
the Creative Commons Attribution 4.0 License.
the Creative Commons Attribution 4.0 License.
 | 04 Sep 2026
Assessing Earth's skin temperature trends: consistent signals from IASI, MODIS, ESA CCI and ERA5
Sarah Safieddine

Selviga Sinnathamby
Juliette Hadji-Lazaro
Marie Doutriaux-Boucher
Darren Ghent
Simon Whitburn
Lieven Clarisse
Cathy Clerbaux
Earth's skin temperature (Tskin), i.e. land, ocean/sea, and ice surface temperatures (LST, SST, and IST), directly reflects surface–atmosphere energy exchanges and is an Essential Climate Variable (ECV). Yet it remains less exploited than near-surface air temperature in climate monitoring. Here, we intercompare and assess the capability of several infrared instruments and Tskin products to monitor climate variability during morning and evening overpasses from a multi-sensor and reanalysis perspective over 2008–2022. Two Infrared Atmospheric Sounding Interferometer (IASI) satellite products are analysed: the EUMETSAT all-sky Climate Data Record (IASI-CDR) and a newly developed clear-sky neural-network product (IASI-NN). These IASI products are compared with the Moderate Resolution Imaging Spectroradiometer MODIS Terra Land Surface Temperature (LST) (v6.1), ESA LST CCI (v3.00), ESA CCI/C3S SST and IST product, and ERA5 skin temperature. Over land, daytime global means agree within ∼ 2 K across datasets, but ESA LST CCI is consistently higher, and deseasonalised anomalies are highly consistent, except for LST CCI, which exhibits sensor-transition discontinuities. At night, MODIS shows a prevalent cold bias relative to all other products. Over the ocean, inter-dataset biases and RMSE between IASI, ERA5 and ESA CCI/C3S SST and IST globally remain below 1 K. Trend analyses reveal robust warming in Tskin since 2008 across the different datasets over land, while significant regional cooling is observed over India (daytime) and parts of central/eastern Africa, and in the southeastern Pacific associated with the Humboldt upwelling system.
- Article
(8054 KB) - Full-text XML
-
Supplement
(793 KB) - BibTeX
- EndNote


Near-surface air temperature is routinely monitored and assimilated in meteorological reanalyses, providing a foundation for climate analysis, but it remains an indirect proxy of surface–atmosphere exchanges. In contrast, land, ocean/sea and ice surface temperatures (LST, SST and IST), collectively referred to as Earth's skin temperature (Tskin), directly capture the thermal state of the Earth's uppermost surface layer and its interaction with the atmosphere.
Tskin responds immediately to changes in radiative forcing, land use, and atmospheric conditions. It is therefore a key variable for studying Earth's energy balance (Hulley et al., 2019), surface convection, drought monitoring, land-use and land-cover changes, and urban heat islands (Rhee et al., 2010; Zhou et al., 2003). Over the ocean, the term “skin temperature” specifically refers to the radiometric temperature of the uppermost ∼ 10–20 µm of the water column – the so-called cool skin layer – which is typically 0.1–0.5 K cooler than the water just below, owing to net heat loss at the air–sea interface (Donlon et al., 2002; Minnett et al., 2019). Owing to its direct sensitivity to surface–atmosphere interactions, Tskin is expected to serve as a reliable tracer of climate variability, provided dataset consistency and quality are ensured. Despite being recognized as Essential Climate Variables (Guillevic et al., 2018), Tskin measurements are still underexploited in climate and urban applications.
For cloud-free scenes, neglecting atmospheric absorption, Tskin can be retrieved from radiances using the inverse of Planck's law (Eq. 1):
where x is the wavenumber in cm−1, L is the radiance W m−2 sr−1 (cm−1)−1, k is Boltzmann's constant = 1.3806 × 10⁻²³ J K−1, h is Planck's constant = 6.6262 × 10⁻³⁴ J s, c is the speed of light in vaccum = 2.9979 × 1010 cm s−1, and ϵ is the surface emissivity. In this study, we compare and evaluate several Tskin and/or LST/SST (including IST) products to assess their spatial–temporal consistency and their ability to capture climate variability. Specifically, we analyse:
-
the Moderate Resolution Imaging Spectroradiometer (MODIS) Terra LST product,
-
the latest European Space Agency (ESA) Climate Change Initiative LST product (LST CCI v3.00, released August 2025),
-
ESA SST CCI and Copernicus climate change service (C3S) Reprocessed Level 4 SST/IST
-
the European Centre for Medium-Range Weather Forecasts (ECMWF) ERA5 reanalysis skin temperature, and
-
two Tskin products from the Infrared Atmospheric Sounding Interferometer (IASI):
- i.
the EUMETSAT (European Organisation for the Exploitation of Meteorological Satellites) all-sky Climate Data Record (IASI-CDR), and
- ii.
a newly developed clear-sky near-real-time neural-network product (IASI-NN).
- i.
Satellite-based Tskin retrievals rely primarily on thermal infrared (TIR) radiometry in atmospheric window channels (8–13 µm), where most natural surfaces have emissivities close to unity, making TIR-derived temperatures a close approximation of the physical skin temperature (Guillevic et al., 2018; Hulley et al., 2019). However, TIR retrievals are only possible under cloud-free conditions, and all TIR observations are affected by atmospheric water vapour absorption. Passive microwave radiometry is less sensitive to cloud cover but surface emissivity in the microwave is highly variable, particularly over land and sea ice, and spatial resolution is considerably coarser (Prigent et al., 2016). Reanalysis products such as ERA5 provide spatially complete, all-sky fields but Tskin is a prognostic model variable constrained by data assimilation rather than a direct observation, making it sensitive to model parameterisations of surface energy balance and land surface properties (Hersbach et al., 2020). These fundamental differences in measurement principle, spatial sampling, and retrieval methodology mean that no single dataset can be considered a universal reference, and systematic intercomparison across products is essential to assess the robustness of Tskin-based climate signals (Ermida et al., 2019; Hulley et al., 2019).
This study offers two important advances. First, it provides the first global intercomparison that brings together different LST and SST/IST datasets. Second, it is the first analysis to examine day- and night-time Tskin trends consistently across all these observing systems, allowing us to assess the diurnal fingerprint of climate change from a multi-sensor perspective. In the following, “Tskin” refers to either land surface temperature (LST) or sea surface temperature (SST, including IST), depending on and if the quantity is provided by each dataset. Section 2 introduces the datasets, Sect. 3 presents their intercomparison, Sect. 4 assesses climate trends and their spatial patterns, and Sect. 5 summarizes the main findings and discusses their implications.
2.1 MODIS LST temperature products
The Land Surface Temperature product is the 6.1 version, developed by NASA's Land Processes Distributed Active Archive Center (LP DAAC). The data is extracted at a 0.05° latitude/longitude grid and provides monthly LST and emissivity data derived from MODIS, carried aboard the Terra (Wan et al., 2021) satellite. regridded to 1° × 1° grid size for discussion and analysis. NASA's Terra is a sun-synchronous, polar orbiting satellite in a morning orbit, with equator crossing times of approximately 10:30 am and 10:30 pm (local time, LT) in descending and ascending modes respectively. In this work, we focus on the Terra satellite because of its close crossing time to the other datasets listed hereafter. Terra (and Aqua) have been drifting to an earlier equatorial crossing time since 2020. NORAD (North American Aerospace Defense Command) data (not shown here) suggests that by the end of 2022, the equatorial crossing time was around 10:11 pm LT, for a total of 19 min drift. The ∼ 19 min drift remains small relative to the monthly sampling used in this study and should not introduce overpass-condition changes capable of biasing the comparisons between the different datasets.
2.2 ESA Land Surface Temperature Climate Change Initiative (LST CCI)
To complement our analysis, we use the ESA LST CCI Monthly Multisensor Infrared (IR) Low Earth Orbit Land Surface Temperature Level 3 Supercollated (L3S) global product, version 3.00 (Ghent et al., 2025), which has been online since August 2025.
Daytime and nighttime temperatures are provided in separate files, corresponding to local solar times of 10:00 am and 10:00 pm, respectively. The instruments contributing to the time series used in this study are AATSR (Advanced Along-Track Scanning Radiometer, until March 2012), MODIS Terra (from April 2012 to November 2018), and SLSTR-B (the Sea and Land Surface Temperature Radiometer on Sentinel 3B, starting in December 2018). For consistency, a common algorithm is applied for LST retrieval across all instruments. In addition, an adjustment is made to account for the half-hour difference in the satellites' equatorial crossing times; this correction is computed in brightness temperature space using radiative transfer simulations (Ghent et al., 2025). Data are retrieved at a 0.01° latitude/longitude grid, that we regridded to 1° × 1° grid size for discussion and analysis.
An important characteristic of the ESA LST CCI that distinguishes it from the NASA MODIS LST product is the restriction of retrievals to view zenith angles (VZA) of ±22°. This restriction is intentional: the full LST CCI data record also includes data from ATSR-2 and AATSR, which have narrower swaths than MODIS or SLSTR, and limiting all sensors to ±22° ensures geometric consistency across the entire multi-decadal record. In contrast, the NASA MODIS LST product uses the full MODIS swath of ±60° VZA. It has been shown that MODIS LSTs are systematically depressed at the edges of the swath due to increased atmospheric path length and angular emissivity effects at high viewing angles (Ermida et al., 2019; Wan, 2014). By averaging over a much wider angular range that includes these colder off-nadir retrievals, the MODIS global mean LST is expected to be lower than the near-nadir-only LST CCI product. This viewing geometry difference is the primary physical explanation for the systematic warm offset of LST CCI relative to MODIS (discussed in Fig. 1), and does not reflect a calibration error.
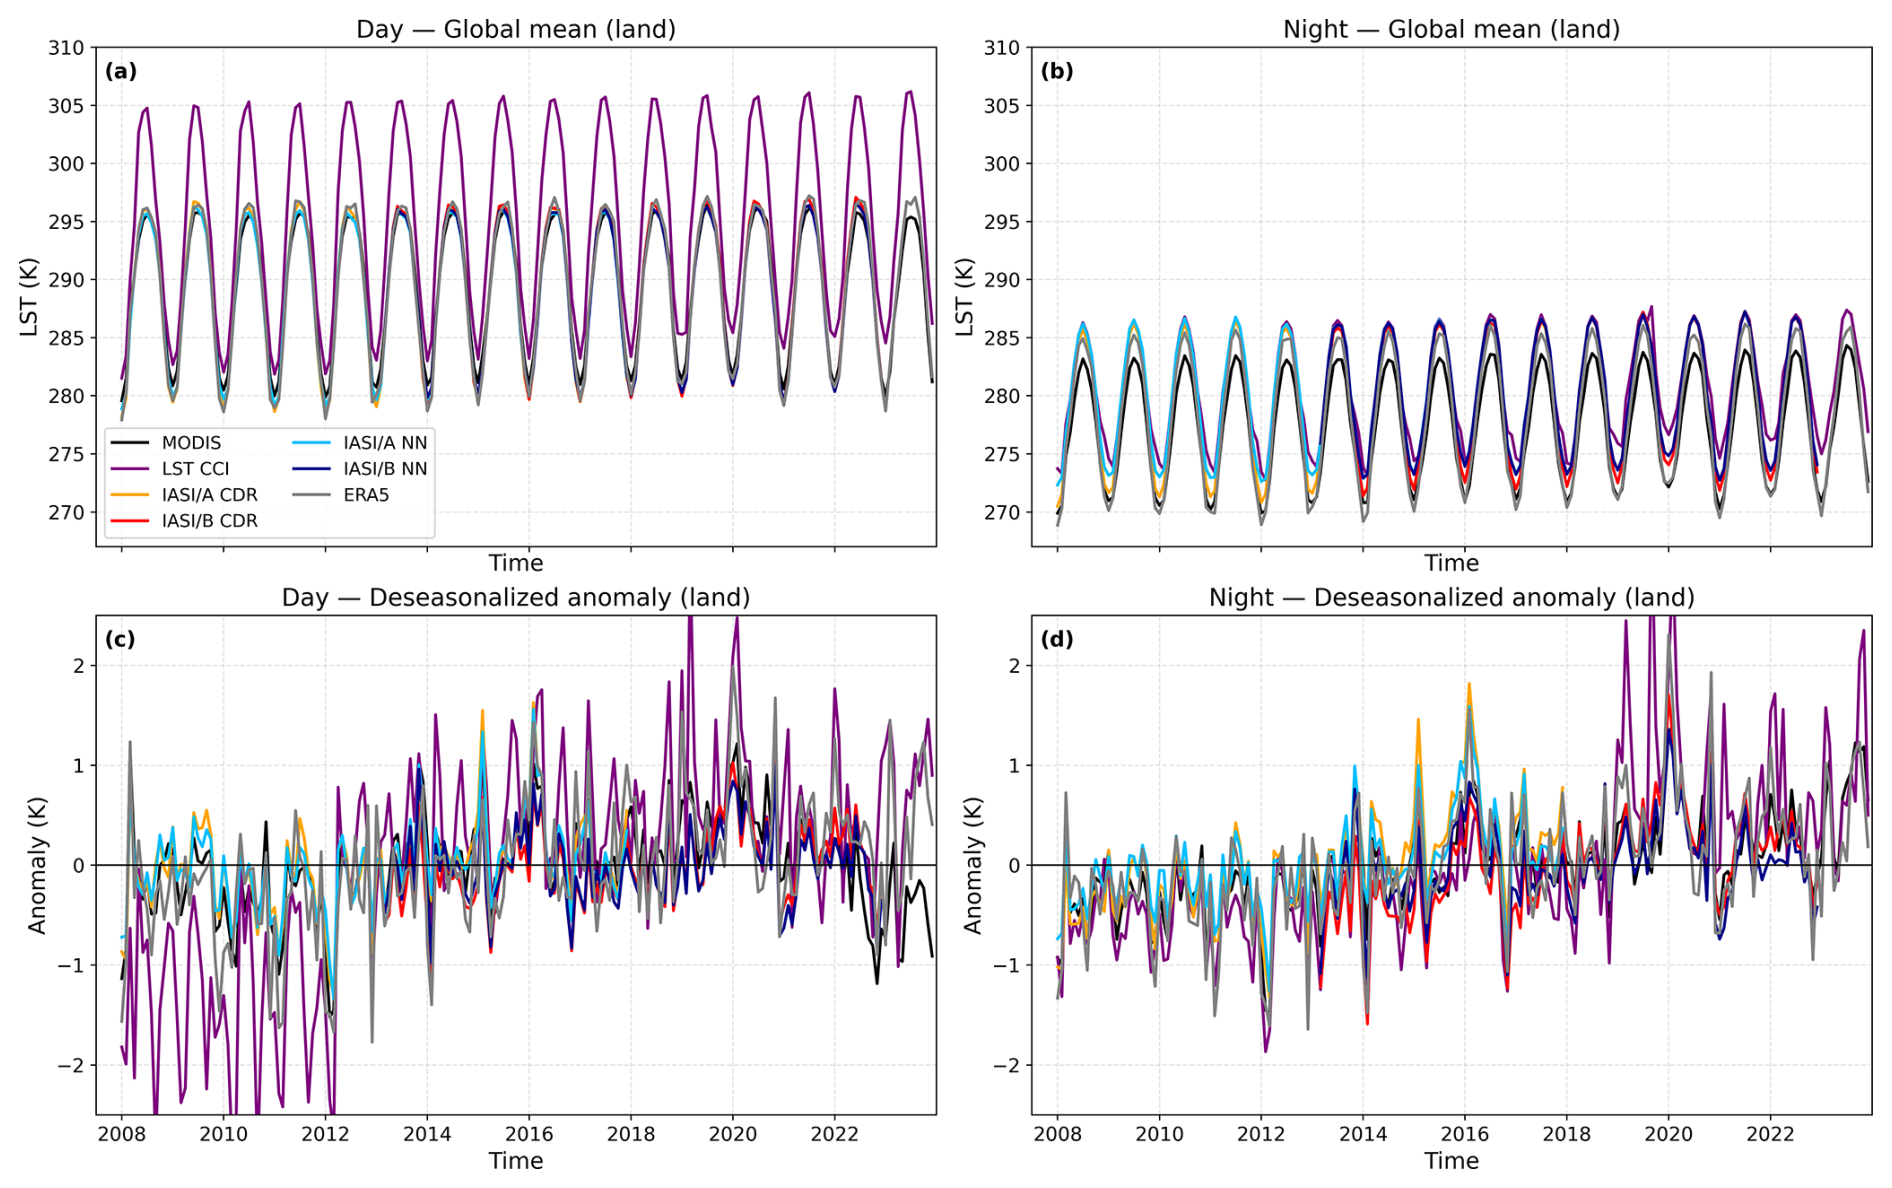
Figure 1Global mean land surface temperature (LST, a, b) and deseasonalised anomalies (c, d) for daytime (a, c) and nighttime (b, d). IASI Metop-A and Metop-B observations (IASI-A/B) are shown separately for the CDR and NN products. Global means are computed using cosine-latitude weighting.
2.3 ESA CCI and Copernicus climate change service (C3S) Reprocessed Level 4 SST/IST
To extend the ocean surface temperature comparison with an independent satellite-based dataset, we include the ESA SST CCI and C3S Reprocessed Sea Surface and Sea Ice Temperature product, distributed through the Copernicus Marine Service (Høyer et al., 2014; Høyer and She, 2007; Nielsen-Englyst et al., 2023). We use the variable “st”, which corresponds to the analysed sea (at 20 cm depth) and ice surface (surface skin) temperature. This Level-4 (L4) product provides gap-free daily analyses at a native horizontal resolution of 0.05° × 0.05°.
The product is generated using the Danish Meteorological Institute Optimal Interpolation (DMIOI) system, which combines input from multiple satellite sources (Embury et al., 2024); and IST retrievals from the AASTI (Arctic and Antarctic Surface Temperatures from thermal Infrared satellite radiometers) and C3S IST Climate Data Record (CDR)/Interim CDR v.1. The inclusion of IST, constrained by a multi-source sea-ice concentration composite, makes this product particularly suited for representing surface temperatures in polar regions, the sea ice, and the marginal ice zone – areas where other SST products are typically undefined or unreliable. The product is extracted over the study period of 2008–2022, which we regrid to a 1° × 1° grid for consistency with the other datasets used in this study. In this work, this dataset is the only one that is all-sky, and not separated between day and night. We refer to it as ESA CCI/C3S SST and it serves as such as a reference to the other SST datasets.
2.4 ERA5 Tskin
We use the Tskin variable from the ERA5 reanalysis (Hersbach et al., 2020), produced by ECMWF, which is framed within the Copernicus Climate Change Service of the European Commission. ERA5 datasets are at 0.25° × 0.25° resolution (native horizontal resolution of ERA5 is ∼ 31 km), that are regridded to a 1° × 1° grid size for the study.
Hourly averages are computed for each month of the year and are then converted to local time by calculating the time zone offset based on the longitude (15° = 1 h). Our analysis does not account for daylight saving time. This is consistent with satellite local-solar-time definitions, as polar-orbiting instruments such as IASI maintain fixed solar crossing times (e.g., 09:30/21:30 LT), independent of civil time zones.
ERA5 should not be treated as an independent ground truth, but rather as a physically consistent reference that is subject to its own model-dependent uncertainties. Over land, ERA5 Tskin is a prognostic variable computed within the HTESSEL (Hydrology-Tiled ECMWF Scheme for Surface Exchanges over Land) land surface scheme (Balsamo et al., 2009), as part of the Integrated Forecast System (IFS). It is integrated forward in time by solving the surface energy balance at each model timestep, and is therefore sensitive to model parameterisations of soil thermal properties, vegetation, and snow. Over ocean, ERA5 Tskin is not prognostic but is instead derived from a prescribed SST analysis with a diagnostic cool-skin correction applied (Hirahara et al., 2016; Zeng and Beljaars, 2005). ERA5 does not directly assimilate Tskin, but does assimilate SST analyses over ocean and infrared radiances over both land and sea (Hersbach et al., 2020), which carry indirect surface temperature information.
2.5 IASI climate data record Tskin product from EUMETSAT
IASI (Clerbaux et al., 2009) is a Fourier transform spectrometer and data are available from three instruments onboard of Metop-A, -B and -C satellites launched in 2006 (end of life in October 2021), 2012, 2018, respectively. Each IASI instrument provides more than 1.2 million radiance spectra per day with a footprint on the ground of 12 km diameter at nadir, and a local crossing time of 09:30 am and 09:30 pm LT. IASI has exceptional spectral and radiometric stability making it a reference instrument (Kilymis et al., 2025). IASI Tskin data are officially distributed by EUMETSAT and is derived from IASI radiances but also relies on two microwave instruments onboard Metop satellites – the Microwave Humidity Sounder (MHS) and the Advanced Microwave Sounding Unit-A (AMSU-A) – particularly for cloudy scenes. Several updates have been made to the processing algorithm over time (Bouillon et al., 2020), which has been relatively stable since 2016, making the product operational but not homogeneous over time. To this end, EUMETSAT provided an all-sky climate data record (IASI-CDR) Tskin product. In this work we use the latest CDR version, 1.1, which is a homogeneously reprocessed dataset from the surface to the top of the atmosphere (EUMETSAT, 2022). The reprocessed temperatures were computed with a piecewise linear regression cube (PWLR3) algorithm, using all IASI observations as input (clear and cloudy scenes). It is a fast and accurate statistical retrieval scheme that exploits the synergy between microwave (MHS, and AMSU) and infrared measurements. PWLR3 is a machine learning algorithm trained with real satellite observations paired with the best correlative representation of the Earth system. The CDR includes four surface parameters (surface pressure, surface air temperature, surface air dew point temperature, and surface skin temperature) as well as the atmospheric profiles of temperature and humidity. Only surface skin temperature is used in this work. The training set used for the algorithm in this CDR is composed of three variables from the European Reanalysis (ERA5): temperature, humidity and ozone, provided at 137 model levels (Hersbach et al., 2020). It uses 96 d of data, i.e., 4 d (1st, 8th, 15th and 22nd) of each month for 2 years in 2015 and 2017. In total, the training set is made up of more than 120 million IASI fields of view. The algorithm defines different observation classes based on the IASI observations and auxiliary information (e.g. surface type and elevation). Then, for each observation class, a linear regression is performed from the IASI/AMSU-A/MHS observation to retrieve the required geophysical parameters.
2.6 IASI clear sky neural network Tskin
The IASI Neural Network (IASI NN) Tskin product used in this study is a clear-sky retrieval based on an information-content channel selection and a neural-network architecture. It is an updated version of the product validated by Safieddine et al. (2020). Surface temperature is derived using 87 window-region channels (750–950 cm−1), reduced from 100 in the first version by removing channels sensitive to carbon dioxide (CO2) to improve long-term stability. The list of channels is provided in Appendix A. A second key update is the use of the EUMETSAT Near Real Time (NRT) Tskin product from 2021 as the training target, replacing ERA5, as was done in Safieddine et al. (2020). This allows the NN to emulate an operational optimal-estimation surface temperature directly derived from IASI and ensures consistency over the entire mission. The NRT product is based on optimal estimation and over the years, EUMETSAT has performed several updates on the real-time processing of both radiances and temperatures, making the time series non-homogeneous, until around 2017 (Bouillon et al., 2020). For this reason, the year 2021 is used as a trustworthy year for the training target.
2.6.1 Auxiliary variables and accounting for monthly and interannual emissivity variability
Over land, emissivity information is included as auxiliary input using the CAMEL (Combined ASTER, Advanced Spaceborne Thermal Emission and Reflection Radiometer, and MODIS Emissivity over Land) dataset. CAMEL merges the MODIS reference emissivity database (University of Wisconsin–Madison) with the ASTER GEDv4 emissivity dataset (Jet Propulsion Laboratory, JPL). It provides global coverage at 5 km resolution with monthly means across 13 spectral bands (3.6–14.3 µm). Four of these bands (10.6, 10.8, 11.3 and 12.1 µm), located within the spectral window relevant for Tskin retrievals, are incorporated into the NN input over land surfaces. The trends in emissivities are shown in the Supplement (Fig. S1). Across all four TIR channels, CAMEL exhibits predominantly negative emissivity trends, with spatially coherent patterns. Although the magnitude of these trends is small (> −0.1 % yr−1), their persistence across channels suggests a systematic signal rather than random noise. The trends in emissivities will therefore affect the Tskin trends and are a necessary input to the Tskin retrievals. We note that this monthly and interannual emissivity variability is not accounted for in ERA5, which relies on static, time-invariant emissivity climatology.
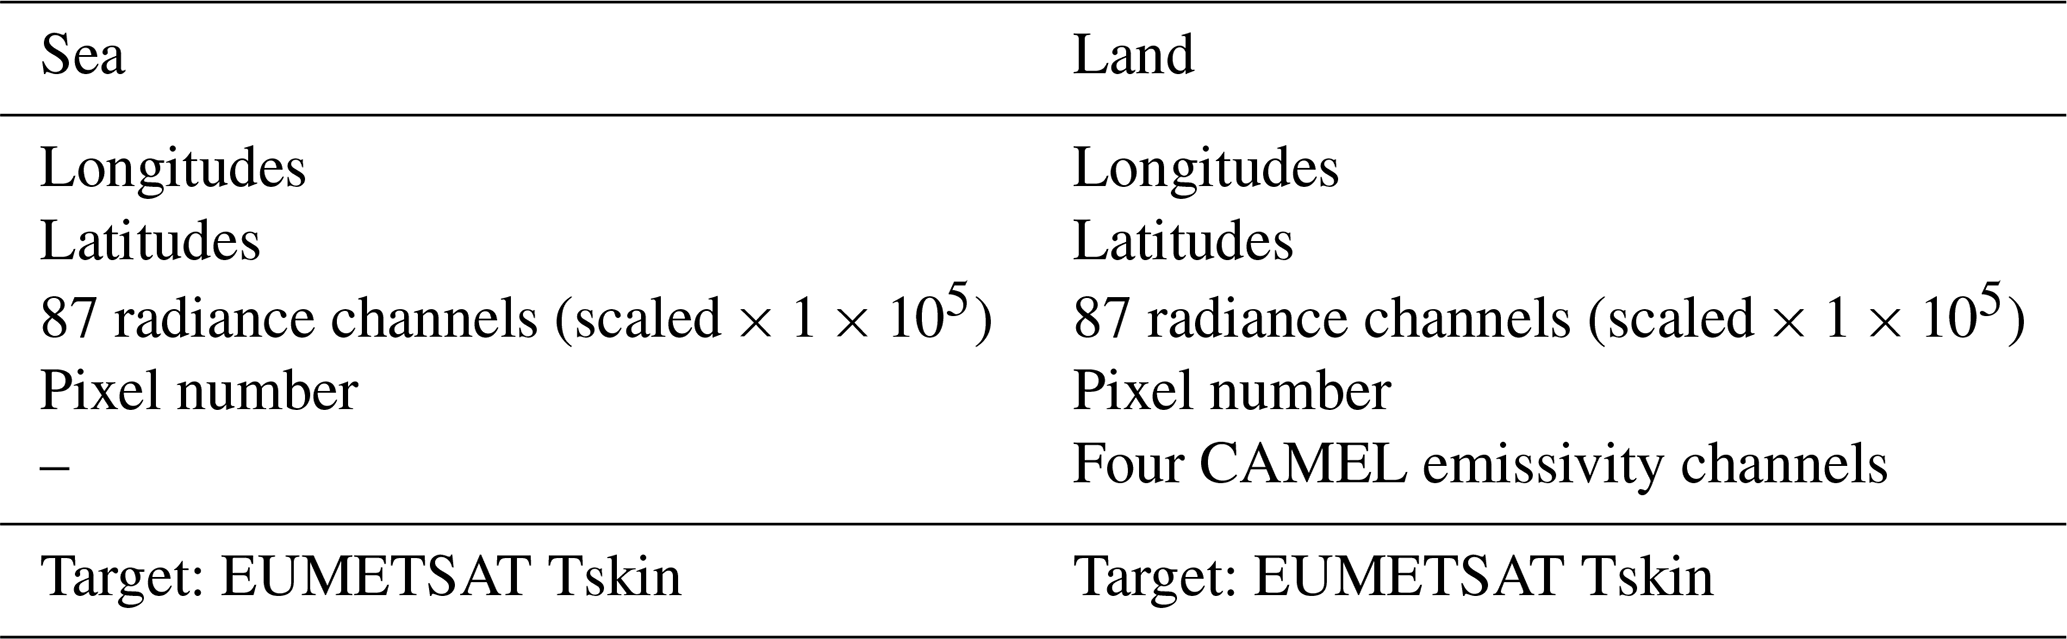
Other auxiliary variables were included following extensive testing: longitude and latitude (rounded to the nearest degree) and the field-of-view (pixel number from 1 to 120, with pixels 57–64 near nadir). The full set of input and target variables is summarised in Table 1.
Table 1Inputs and target variables for neural network training. Total features/inputs: 90 over sea and 94 over land. Target variable: EUMETSAT Tskin.
The dataset was split into training (70 %), validation (9 %) and test (21 %) subsets. Hyperparameters were tuned with a batch size of 100 and a learning rate of 10−3 using the Adam optimizer. Training was performed for 200 epochs over the sea and 400 epochs over the land, reflecting the slower convergence behaviour of the latter. To ensure consistent scaling across features, a TensorFlow normalization layer was applied to normalize inputs to zero mean and unit variance.
To improve clear-sky detection, this version uses the cloud mask developed by Whitburn et al. (2022). This IASI-derived deep-learning cloud product is explicitly designed to be insensitive to CO2 variability, enhancing long-term climate stability. Its performance has been validated against MODIS and AVHRR (Advanced Very High-Resolution Radiometer), showing improved accuracy across a wide range of atmospheric and surface conditions.
2.6.2 IASI measurement periods and satellites used
The two IASI-based Tskin datasets (NN and CDR) cover the following periods and instruments:
-
July 2007–January 2013: Metop-A (only satellite in orbit)
-
February 2013–December 2017: Metop-A + Metop-B (Metop-B available from 20 February 2013)
-
January 2018–December 2022: Metop-B only (Metop-A orbit drift beginning July 2017 affected its equatorial crossing time, progressively influencing Tskin retrievals until end of life in 2021)
Since the EUMETSAT CDR does not include Metop-C for the years 2020–2022, Metop-C is not used in this study.
2.7 Interdependency between datasets
The datasets used in this study are not fully independent of one another, which is relevant when interpreting intercomparison results. ERA5 assimilates IASI radiances for atmospheric profile retrieval (Hersbach et al., 2020), which partially constrains its land surface scheme and thus its Tskin. IASI-CDR in turn uses ERA5 atmospheric profiles as training input, introducing a dependency on ERA5. IASI-NN uses the EUMETSAT NRT product as its training target, making it more independent than IASI-CDR on ERA5; however, it incorporates MODIS emissivities as auxiliary input, linking it partially to the MODIS instrument which retrieves LST directly from infrared radiances (and is effectively independent of ERA5 Tskin). Finally, LST CCI, although also derived from infrared radiances, was intercalibrated against IASI (Ghent et al., 2025), introducing a degree of dependency between these two datasets. The ESA CCI/C3S SST and IST product is derived from an independent suite of satellite radiometers and is anchored to in-situ drifting-buoy measurements (Embury et al., 2024), making it largely independent of both the IASI and ERA5 datasets with SST products used here.
Over sea-ice-covered regions, the definition and measurement of Tskin becomes more complex. Infrared satellite retrievals such as IASI and MODIS are sensitive to the radiometric skin temperature of the ice surface, but their accuracy depends on cloud screening and surface emissivity characterisation, both of which are particularly challenging in polar regions. ERA5 treats sea ice explicitly through a dedicated surface scheme. In this study, sea-ice-covered areas are not analysed separately and are included within SST, and the inter-dataset biases observed at high latitudes and discussed later are partly attributable to these differences in sea-ice treatment across datasets.
2.8 Cloud filtering strategy
To ensure a physically consistent intercomparison, all datasets are evaluated under clear-sky conditions. Each dataset is filtered using the most appropriate cloud screening method. For IASI-NN, clear-sky retrievals are already guaranteed by the cloud mask of Whitburn et al. (2022), which is applied at the pixel level prior to retrieval. The same cloud mask is applied to IASI-CDR, retaining only those IASI-CDR retrievals collocated in space and time with IASI-NN clear-sky pixels. Since both products share the same instrument, orbital swath, and overpass times, this constitutes a physically consistent filter that ensures both IASI products are evaluated over identical scenes.
For ERA5, we apply a threshold on the total cloud cover (tcc) variable, ERA5's native cloud diagnostic, retaining only grid points and time steps where tcc < 0.2 (20 %). This clear-sky criterion is consistent with the approach used in comparable studies (Ermida et al., 2019; Ermida and Trigo, 2022), which also demonstrate through sensitivity analysis that varying the cloud fraction threshold between 1 % and 30 % changes the derived clear-sky bias by less than 0.5 K for 85 % of grid points. Moreover, the ERA5 Tskin trends derived from monthly cloud-filtered data are shown to be robust across a wide range of cloud cover thresholds (Wang et al., 2022).
MODIS Terra LST (v6.1) and ESA LST CCI (v3.00) are clear-sky products by construction, as their retrieval algorithms only produce valid retrievals under cloud-free conditions; no additional cloud filtering is therefore applied to these datasets.
The ESA SST CCI/C3S SST and IST product combines infrared clear-sky retrievals with all-sky passive microwave observations through optimal interpolation, and is therefore not cloud-filtered. Applying a cloud mask, a posteriori, using ERA5 monthly cloud cover fraction, for example, would be the only feasible approach to approximate clear-sky conditions, but this would introduce an ERA5-dependent filtering that is inconsistent with the cloud screening applied to IASI and MODIS, which is based on their own instrument-level detection. We therefore present the ESA CCI/C3S SST and IST product as an all-sky all-day reference.
All datasets are regridded onto a 1° × 1° grid and averaged monthly over the period common to all datasets (2008 to 2022). In terms of temporal sampling, all datasets are evaluated at comparable local solar times (except for the ESA CCI/C3S SST), spanning a window of approximately 09:30 to 10:30 LT for daytime and 21:30 to 22:30 LT for nighttime. Specifically, IASI crosses the equator at 09:30 LT, MODIS Terra at approximately 10:30 LT, and LST CCI is provided at 10:00 LT. ERA5 hourly data are sampled at 10:00 LT by applying a longitude-based offset (15° longitude = 1 h), without correction for daylight saving time, consistent with the fixed solar crossing times of polar-orbiting satellites. No further correction for the residual 30–60 min spread between instruments is applied beyond what is already performed internally within the LST CCI product (Ghent et al., 2025). At the monthly timescale used throughout this study, this residual temporal offset is not expected to introduce biases of climatological significance. Furthermore, all datasets are evaluated under clear-sky conditions, as described in Sect. 2.8 (except for the ESA CCI/C3S SST). It should be noted that the cloud screening method differs necessarily across datasets, as each product applies its own retrieval-specific approach. While this means the clear-sky subsets are not strictly identical across products, no universally applicable cloud mask exists that could be applied consistently across such diverse observing systems and reanalysis products, and the approach adopted here represents the most physically appropriate filtering strategy for each dataset. One additional asymmetry in the cloud filtering strategy concerns ERA5. Unlike the satellite products, for which cloud screening is applied at the individual retrieval or overpass level before monthly aggregation, ERA5 cloud filtering is applied to monthly-mean total cloud cover. This means that months with episodic cloudiness but low mean cloud cover may be retained, resulting in a less strict effective clear-sky selection than for the satellite datasets.
3.1 Land Surface Temperature Analysis
We show in Fig. 1, the global averages of LST (upper panels), and the deseasonalised anomaly (lower panels) from the 5 LST datasets used in this study (MODIS, CCI, ERA5, IASI CDR, IASI NN), during the day (left) and the night (right). For the Tskin, i.e., land + sea datasets (ERA5, IASI CDR et IASI NN), a sea mask is applied based on ERA5 (land/sea mask).
During daytime, LST CCI is systematically warmer than the other datasets in the global mean (Fig. 1, upper-left), yielding the highest LST values throughout most of the record. The deseasonalised anomalies display very good agreement among the different datasets, except for LST CCI. The shift from AATSR to MODIS/Terra in April 2012 is clearly visible in the anomaly time series, as is another shift in late 2018 (nighttime), corresponding to the introduction of SLSTR-B into the CCI dataset. This version of the CCI product has not yet been validated. Here we show that the addition of new sensors appears to affect the homogeneity of the LST time series.
At night, MODIS provides the lowest LST values. MODIS has the latest overpass time among the products considered, so we would expect that Tskin at 10:30 pm LT (Terra) to be lower than those at 09:30 pm LT (IASI) or at 10:00 pm LT (ERA5 and LST CCI). However, the magnitude of the MODIS cold bias cannot be explained solely by differences in equator-crossing times. To investigate this further, Fig. 2 presents the spatial bias of MODIS with respect to the four other datasets. A pronounced nighttime cold bias is evident across all comparisons, including LST CCI, which includes MODIS data (but a distinct retrieval algorithm, see Sect. 2). Tan et al. (2021) validated MODIS LST against ground measurements and found a negative nighttime bias at most stations, with an average of −1.58 K. In high-latitude regions, cold biases have also been reported in the Arctic (Muster et al., 2015) and in Antarctica (Zhai et al., 2024), often linked to cloud-screening issues that affect the retrievals. Surface heterogeneity – including snow/ice, permafrost, and arid regions – can further influence MODIS LST (Hachem et al., 2012), though these challenges extend to other satellite products as well. In urban areas, nighttime MODIS LST retrievals have been shown to exhibit non-negligible errors (Yoo et al., 2022).
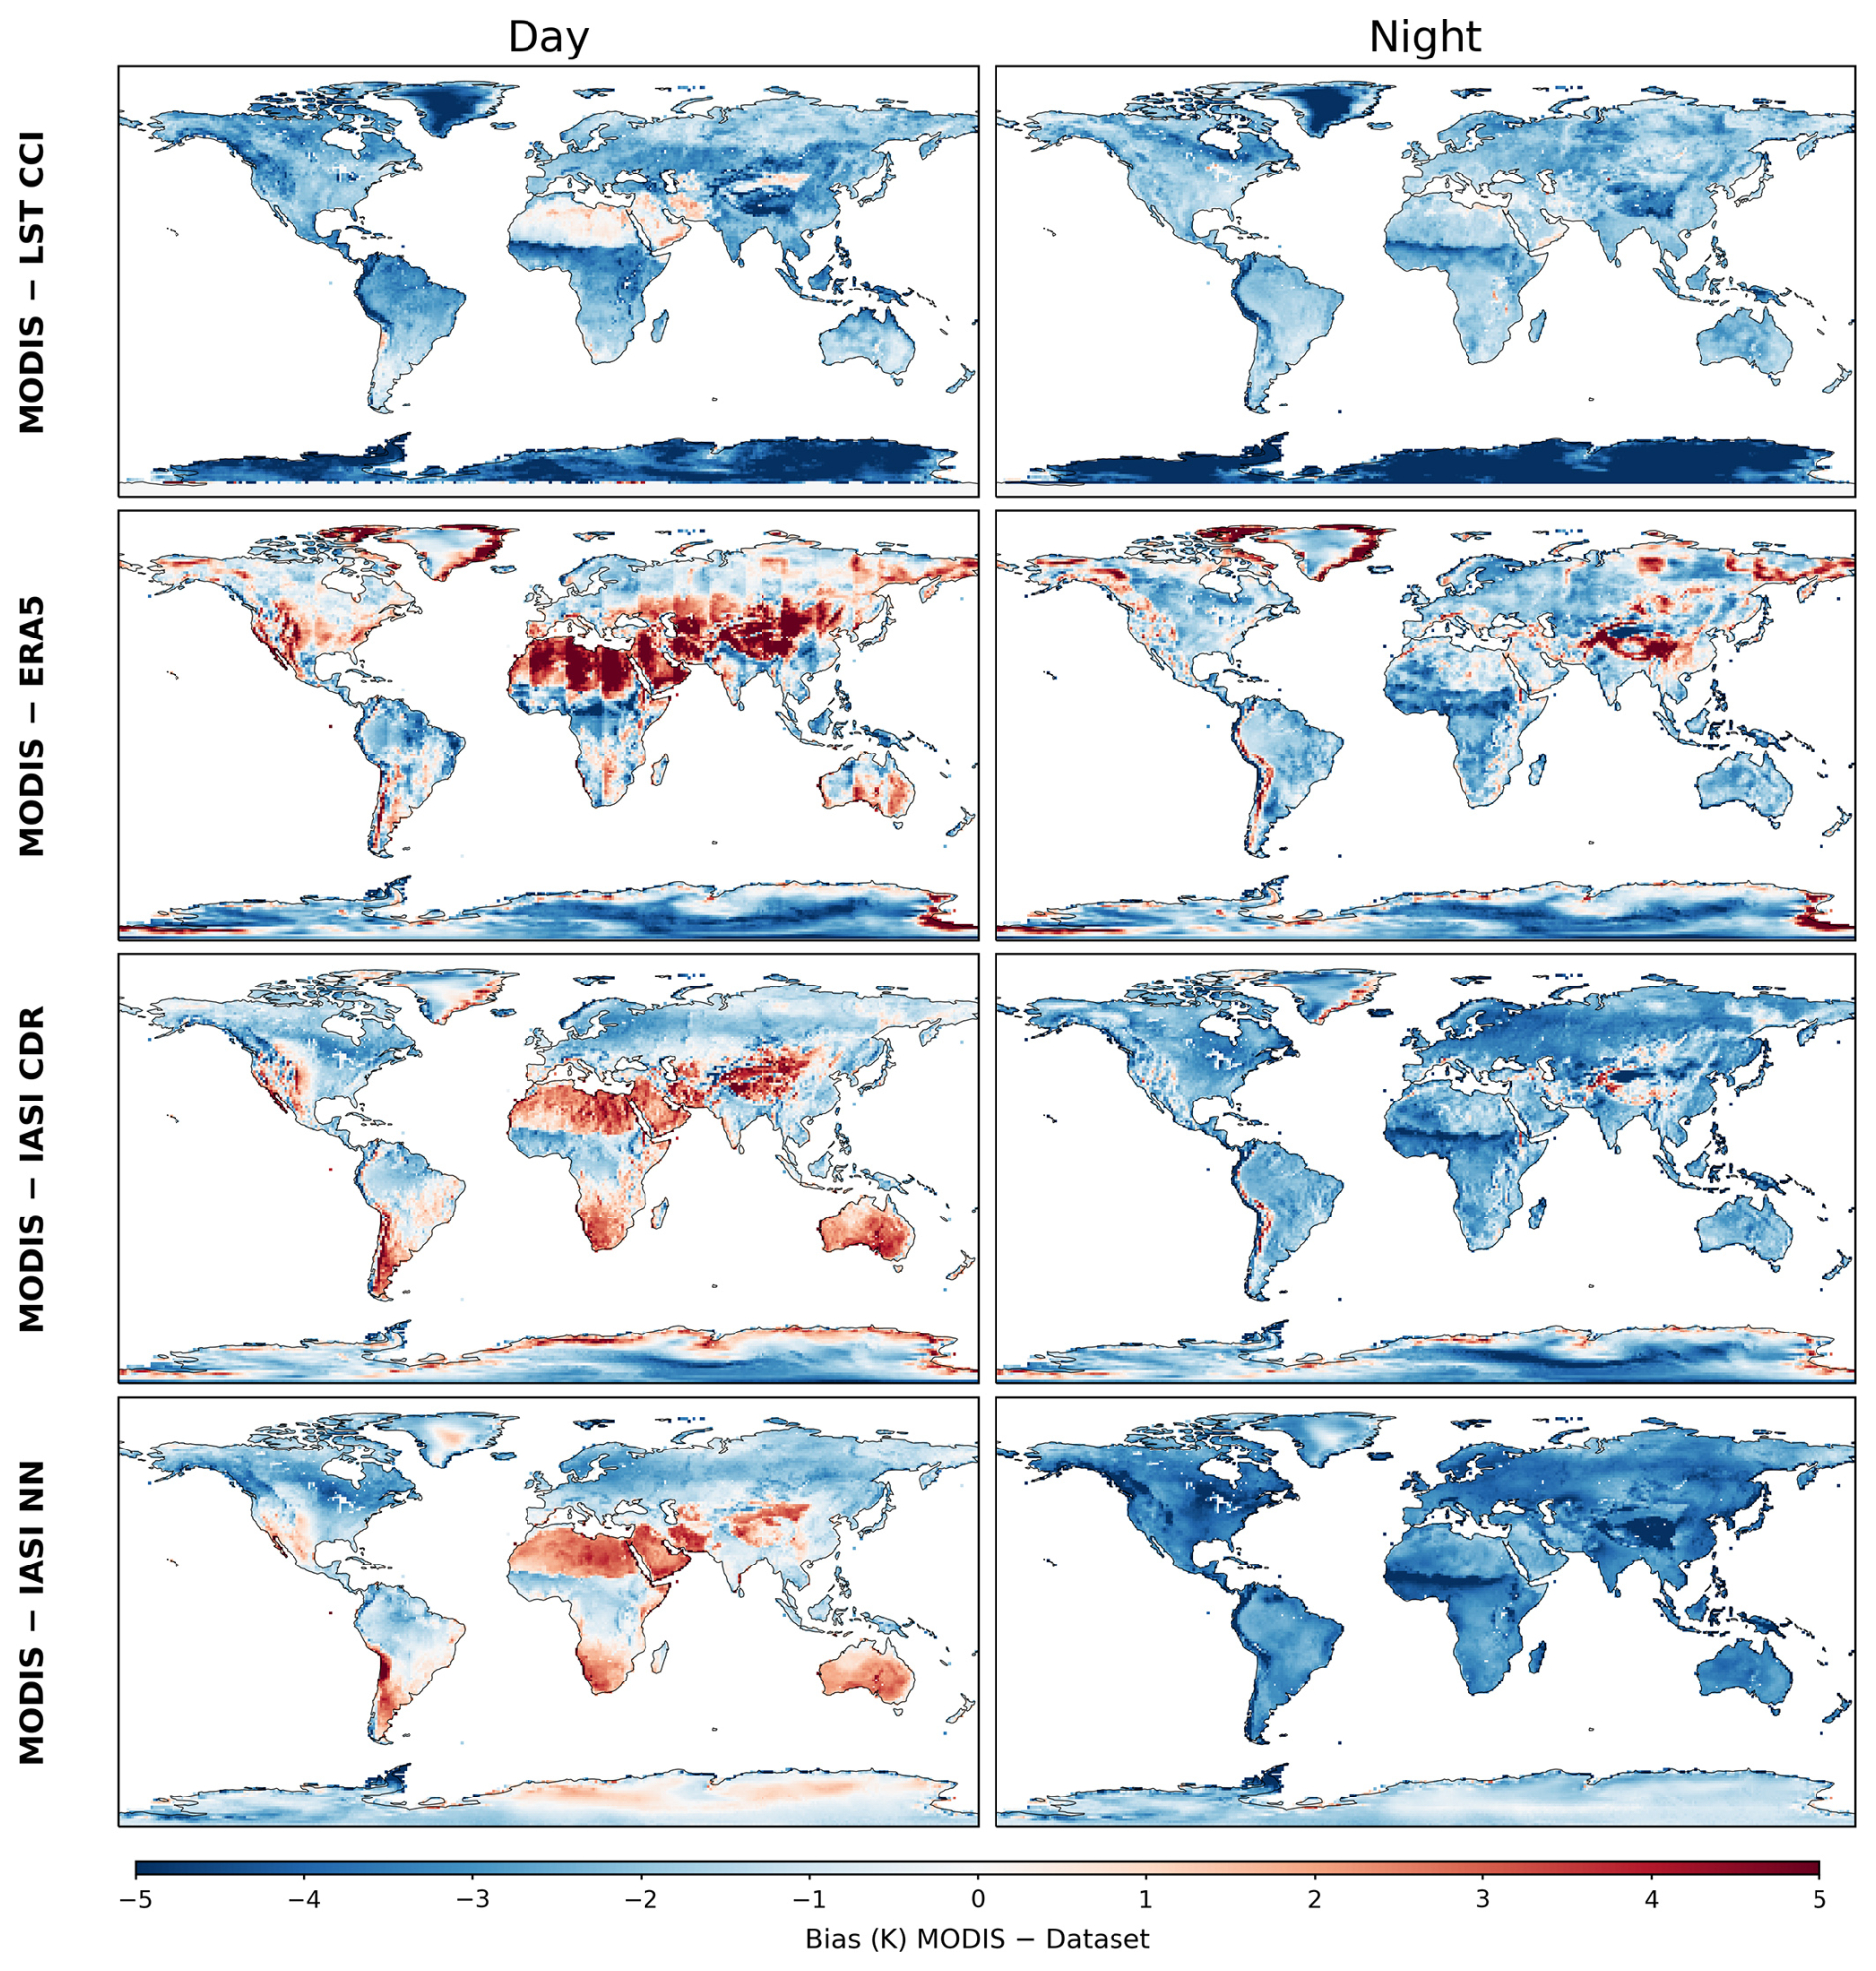
Figure 2LST spatial bias averaged over the 2007–2022 period of MODIS during the day (left) and the night (right), with respect to LST CCI, ERA5, IASI-CDR and IASI-NN. A cold nighttime bias with respect to MODIS is evident across all datasets. ERA5 land/sea mask is used to mask IASI and ERA5 sea grid points.
Figure 2 highlights the widespread MODIS negative (cold) bias over land at night. This suggests that the MODIS V6.1 LST product used here may exhibit a generalized nighttime cold bias that warrants further investigation. The daytime bias is smaller in magnitude, especially with LST CCI, and more spatially variable. When comparing MODIS to ERA5, the longitude “stripes” appears because of the local time conversion method (see Sect. 2.3). IASI-NN and MODIS agrees more in arid and ice-covered region likely because our neural-network product incorporates emissivity information derived (partly) from MODIS. Pronounced discrepancies between MODIS and ERA5 (as well as IASI-CDR trained with ERA5) over the Tibetan Plateau are consistent with known limitations of reanalyses in high-altitude and complex terrains (Khadka et al., 2022; Liu et al., 2024).
In Fig. S2, we show the RMSE for the same pairs of datasets. The RMSE is generally between 1 and 3 K over most land surfaces during both day and night, with higher values exceeding 4–5 K over arid regions and at high latitudes. These elevated RMSEs reflect local surface heterogeneity and variable emissivity conditions rather than a systematic global offset. The consistency between the spatial patterns of bias (Fig. 2) and RMSE (Fig. S2) indicates that the global mean bias values (reported in Fig. 3) are not artefacts of spatial cancellation, but represent a genuine, if spatially non-uniform, systematic difference between the datasets.
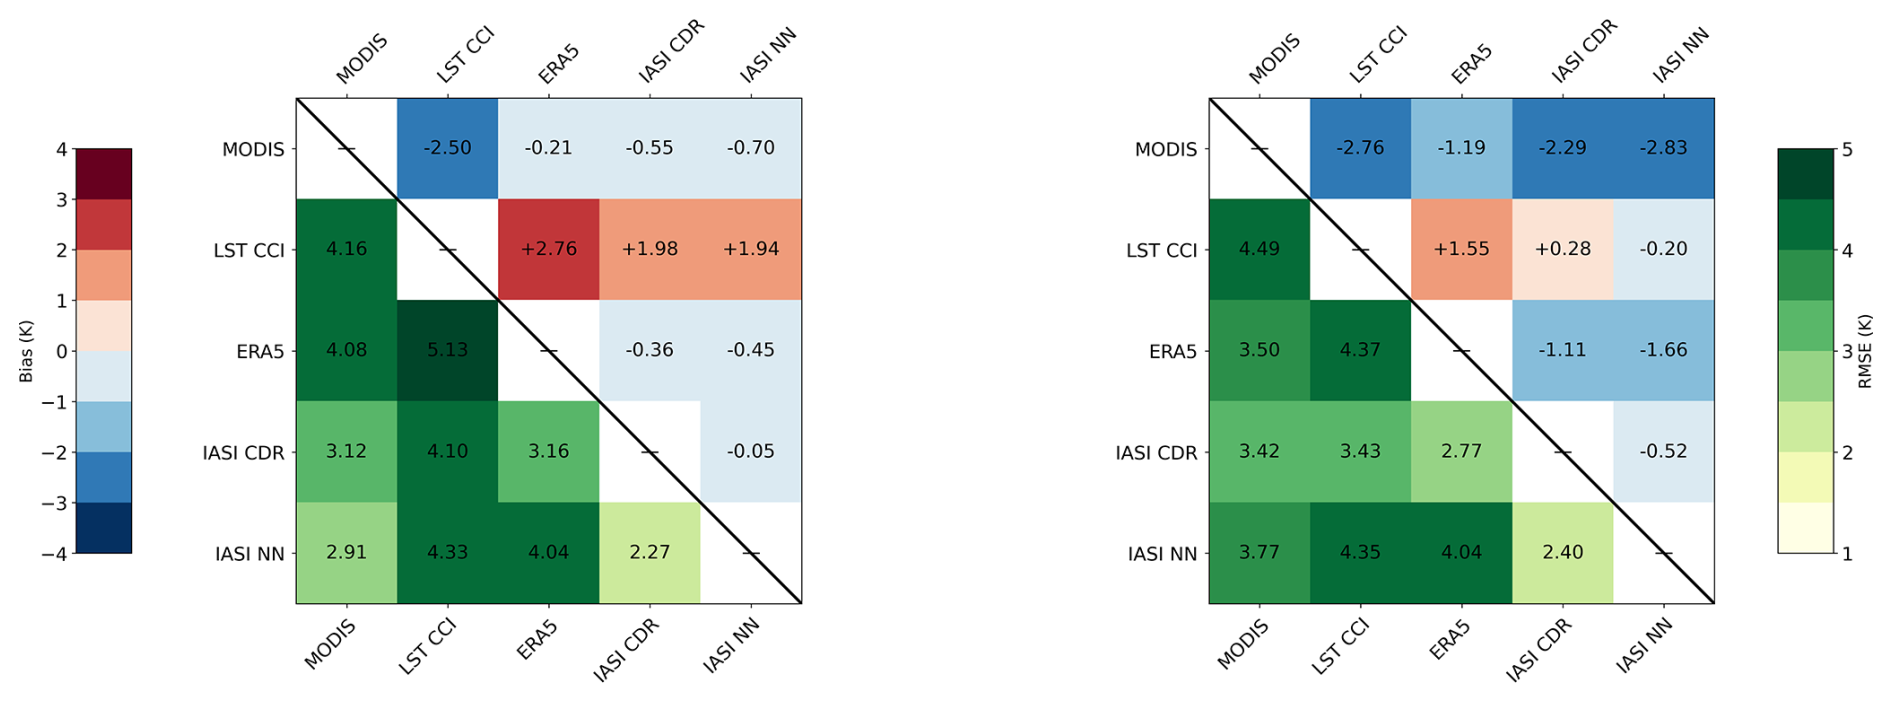
Figure 3Upper triangle (blue to red): global mean bias (row – column). Lower triangle (in yellow to green): root mean square error (RMSE) between the different pairs of LST datasets, for daytime (left) and nighttime (right). Statistics are computed over land grid cells only (using the ERA5 land-sea mask) and weighted by cosine-latitude.
We then show and compute the global averaged bias and root mean square errors (RMSE) over land areas, and between the different datasets in Fig. 3. Both metrics were computed as spatially weighted averages using cos(latitude) weighting to account for the varying grid-cell area with latitude.
The datasets show good agreement during the day, with biases between the different products lower than 1 K (except for LST CCI, with biases between −2.5 and 2.7). RMSE values are between 2 and 3 for the datasets except for LST CCI. RMSE values are the highest for the LST CCI dataset during the day, representing the overall lower accuracy of this dataset. During the night, both the biases and RMSE are higher for MODIS with respect to the other datasets, as it was shown in Figs. 1 and 2. The IASI-NN product shows biases below 1 K when compared with MODIS, ERA5, and the IASI-CDR dataset during the day, and has an average bias of 1.94 K relative to LST CCI. At night, IASI-NN agrees well with the other products (< 1.7 K), except for MODIS, as shown and discussed previously.
3.2 Sea Surface Temperature Analysis
Figure 4 presents, similarly to Fig. 1, the intercomparison of sea and ice surface temperature (called here SST, which includes IST) from the datasets providing this variable: ERA5 at 10:00 am/10:00 pm LT, the IASI-CDR, IASI-NN (at 09:30 am/09:30 pm LT), and the all sky, all day ESA CCI/C3S SST (labeled here simply by ESA CCI/C3S) shown in dotted black line. It is the same for the day and night panels as it is a combined product. The ERA5 land-sea mask is applied to the first three global datasets. The upper panel shows the global mean SST, and the lower panels display day- and night-time anomalies. We note that the y-axis ranges for both the time series and anomalies in Fig. 4 are smaller than those in Fig. 1 for LST, consistent with the lower variability of SST relative to land temperatures. The deseasonalized anomaly time series (Fig. 1c and d) show strong consistency across all datasets in both timing and amplitude of interannual variability, including the 2015–2016 El Niño warming and the subsequent 2020–2022 La Niña cooling. Larger inter-dataset differences, in particular post-2020 for IASI (CDR and NN), reflect systematic offsets attributable to differences in clear-sky sampling strategy rather than spurious trends or variability. The stronger negative anomalies in IASI during 2020–2022 are consistent with the La Niña period, during which increased cloudiness in the tropics reduces the availability of clear-sky retrievals, causing the IASI global mean to be cooler. The ESA CCI/C3S SST product shows systematically damped anomaly peaks in both the positive and negative directions relative to the clear-sky datasets, consistent with the spatial and temporal smoothing inherent to the optimal interpolation scheme used to produce gap-free, all sky, all day coverage, which reduces the amplitude of extreme anomalies by construction.
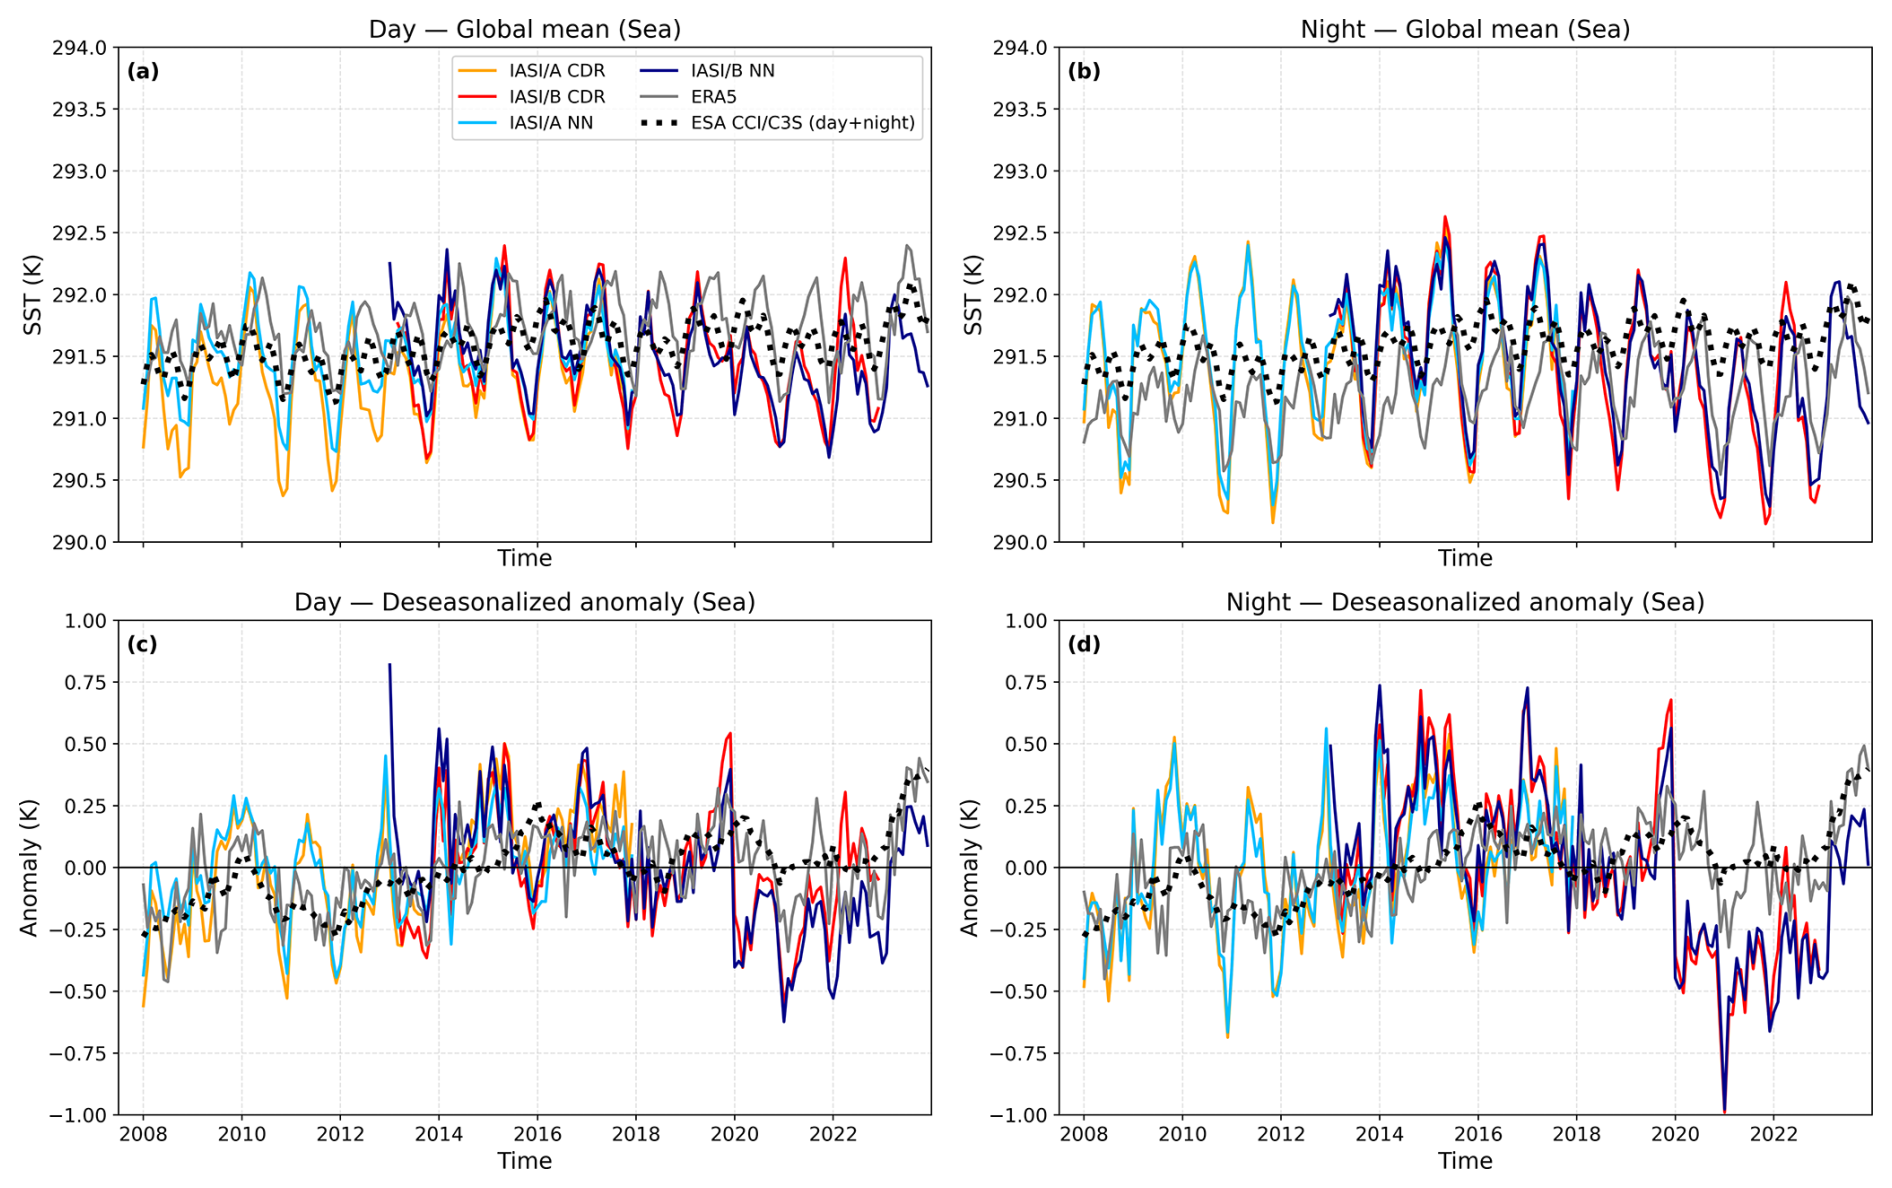
Figure 4Upper panels: SST global mean during the day (a) and the night (b) for ERA5, IASI-CDR and IASI-NN, and ERA5 CCI and C3S SST all-sky product which is shown in dotted black line. It is the same for the day and night panels as it is a combined product. IASI data are separated between Metop A and Metop B. Lower panels: the deseasonalized anomaly of SST for the different products, during the day (c) and night (d). Global means are computed using cosine-latitude weighting.
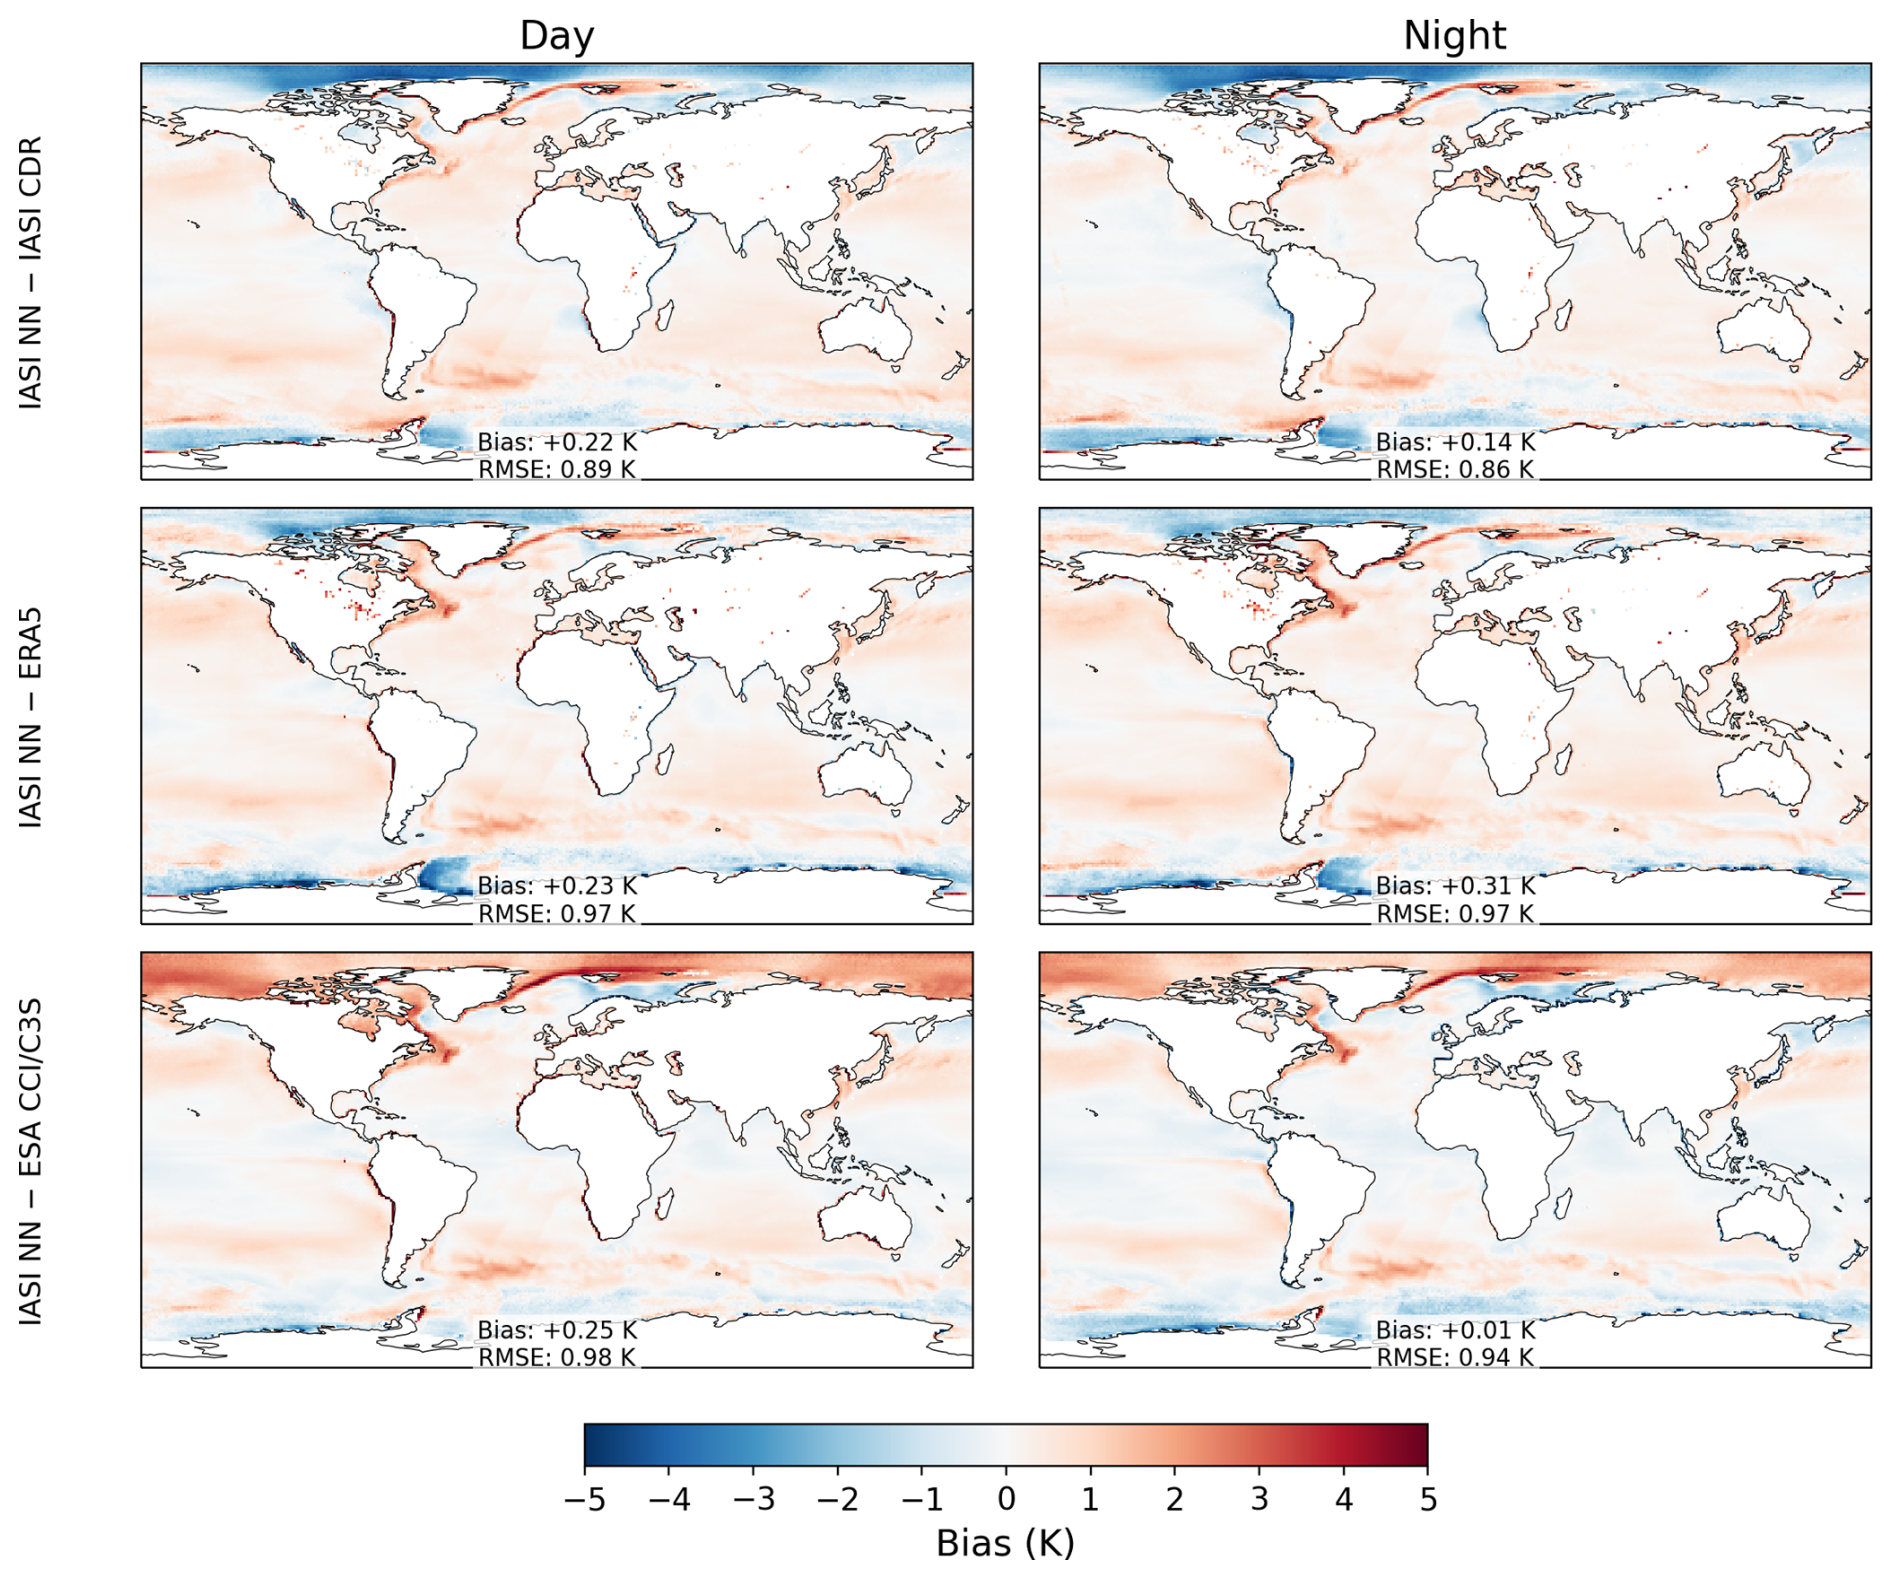
Figure 5Spatial bias of IASI-NN ocean skin temperature relative to IASI-CDR, ERA5, and the ESA CCI/C3S SST analysis. Maps show daytime (left column) and nighttime (right column) biases, computed as the time mean of the monthly-mean differences over the datasets' common period (2008–2022). The ESA CCI/C3S product is a gap-filled, all-sky, with no day/night separation, so the same daily field is differenced against both the daytime and nighttime IASI-NN fields; IASI and ERA5 are restricted to clear-sky scenes. All datasets were regridded to a common 1° × 1° grid and land points were masked using the ERA5 land–sea mask. Sea-ice-covered grid cells are classified as ocean by this mask and are therefore included. Global mean bias and RMSE, area-weighted by the cosine of latitude, are indicated in each panel.
Biases between the IASI-NN SST product (all sky, all day average) and IASI-CDR, ERA5, and ESA CCI/C3S are shown in Fig. 5 (for IASI, Metop-A and Metop-B are averaged together). We note that the biases between the datasets are much smaller than the land ones (Figs. 1 and 2) and similar between daytime and nighttime, primarily because the ocean surface is more homogeneous. Over the open ocean, IASI-NN agrees closely with all three products: global mean biases are small (+0.01 to +0.31 K), RMSE stays below 1 K in every panel, and differences across most of the ice-free ocean lie within ±1 K. Thin warm filaments along the western boundary currents (Gulf Stream, Kuroshio) mark sharp SST fronts that are smoothed in the gap-filled ESA CCI/C3S analysis. The largest discrepancies are confined to high latitudes and differ in sign between products. Sharing the same instrument and the same clear-sky sampling, IASI-NN and IASI-CDR isolate the effect of the retrieval method: they show the closest agreement of all pairs (RMSE < 0.9 K), with IASI-NN colder than IASI-CDR over the Arctic, consistent with IASI-CDR being trained on, and therefore not independent of, ERA5 (Sect. 2.7). Relative to ERA5, IASI-NN is colder over the Southern Ocean, in line with ERA5's documented warm bias over sea ice (Graham et al., 2019; Herrmannsdörfer et al., 2023); relative to the all-sky ESA CCI/C3S analysis it is instead warmer across the Arctic. These contrasting signs indicate that the high-latitude spread reflects the differing definition, retrieval and sea-ice treatment of skin temperature across the datasets (Sect. 2.7) rather than a single common cause.
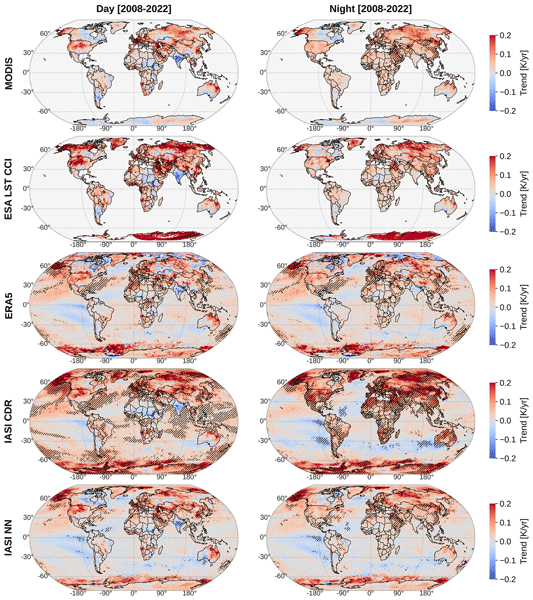
Daytime and nighttime LST/Tskin/SST trends from the MODIS, ESA CCI LST, ERA5, IASI CDR, IASI NN (all clear sky), and ESA CCI/C3S SST and IST (all sky, day and night) products for the period January 2008–December 2022 are shown in Fig. 6. This period is selected as the IASI CDR product ends on the December 2022 (Sect. 2). Trends are computed using the Theil-Sen estimator on yearly deseasonalised averages of LST/Tskin/SST in each grid cell (Sen, 1968; Theil, 1992). The Theil-Sen estimator is a robust trend detection method that calculates the slope between all pairs of data points and takes the median of these slopes. Positive (negative) trends are given in red (blue) shades and statistically significant trends are hatched. Trend significance is assessed using the Mann–Kendall test (Kendall, 1975; Mann, 1945), with trends considered significant when the p-value is below 0.05. We first note that LST CCI daytime trend results should be interpreted with caution. As shown in Sect. 3, LST CCI exhibits a marked daytime inhomogeneity around 2012, associated with the sensor transition from AATSR to MODIS Terra within the CCI processing chain. This discontinuity affects the daytime time series over land and may introduce spurious signals in the derived trends.
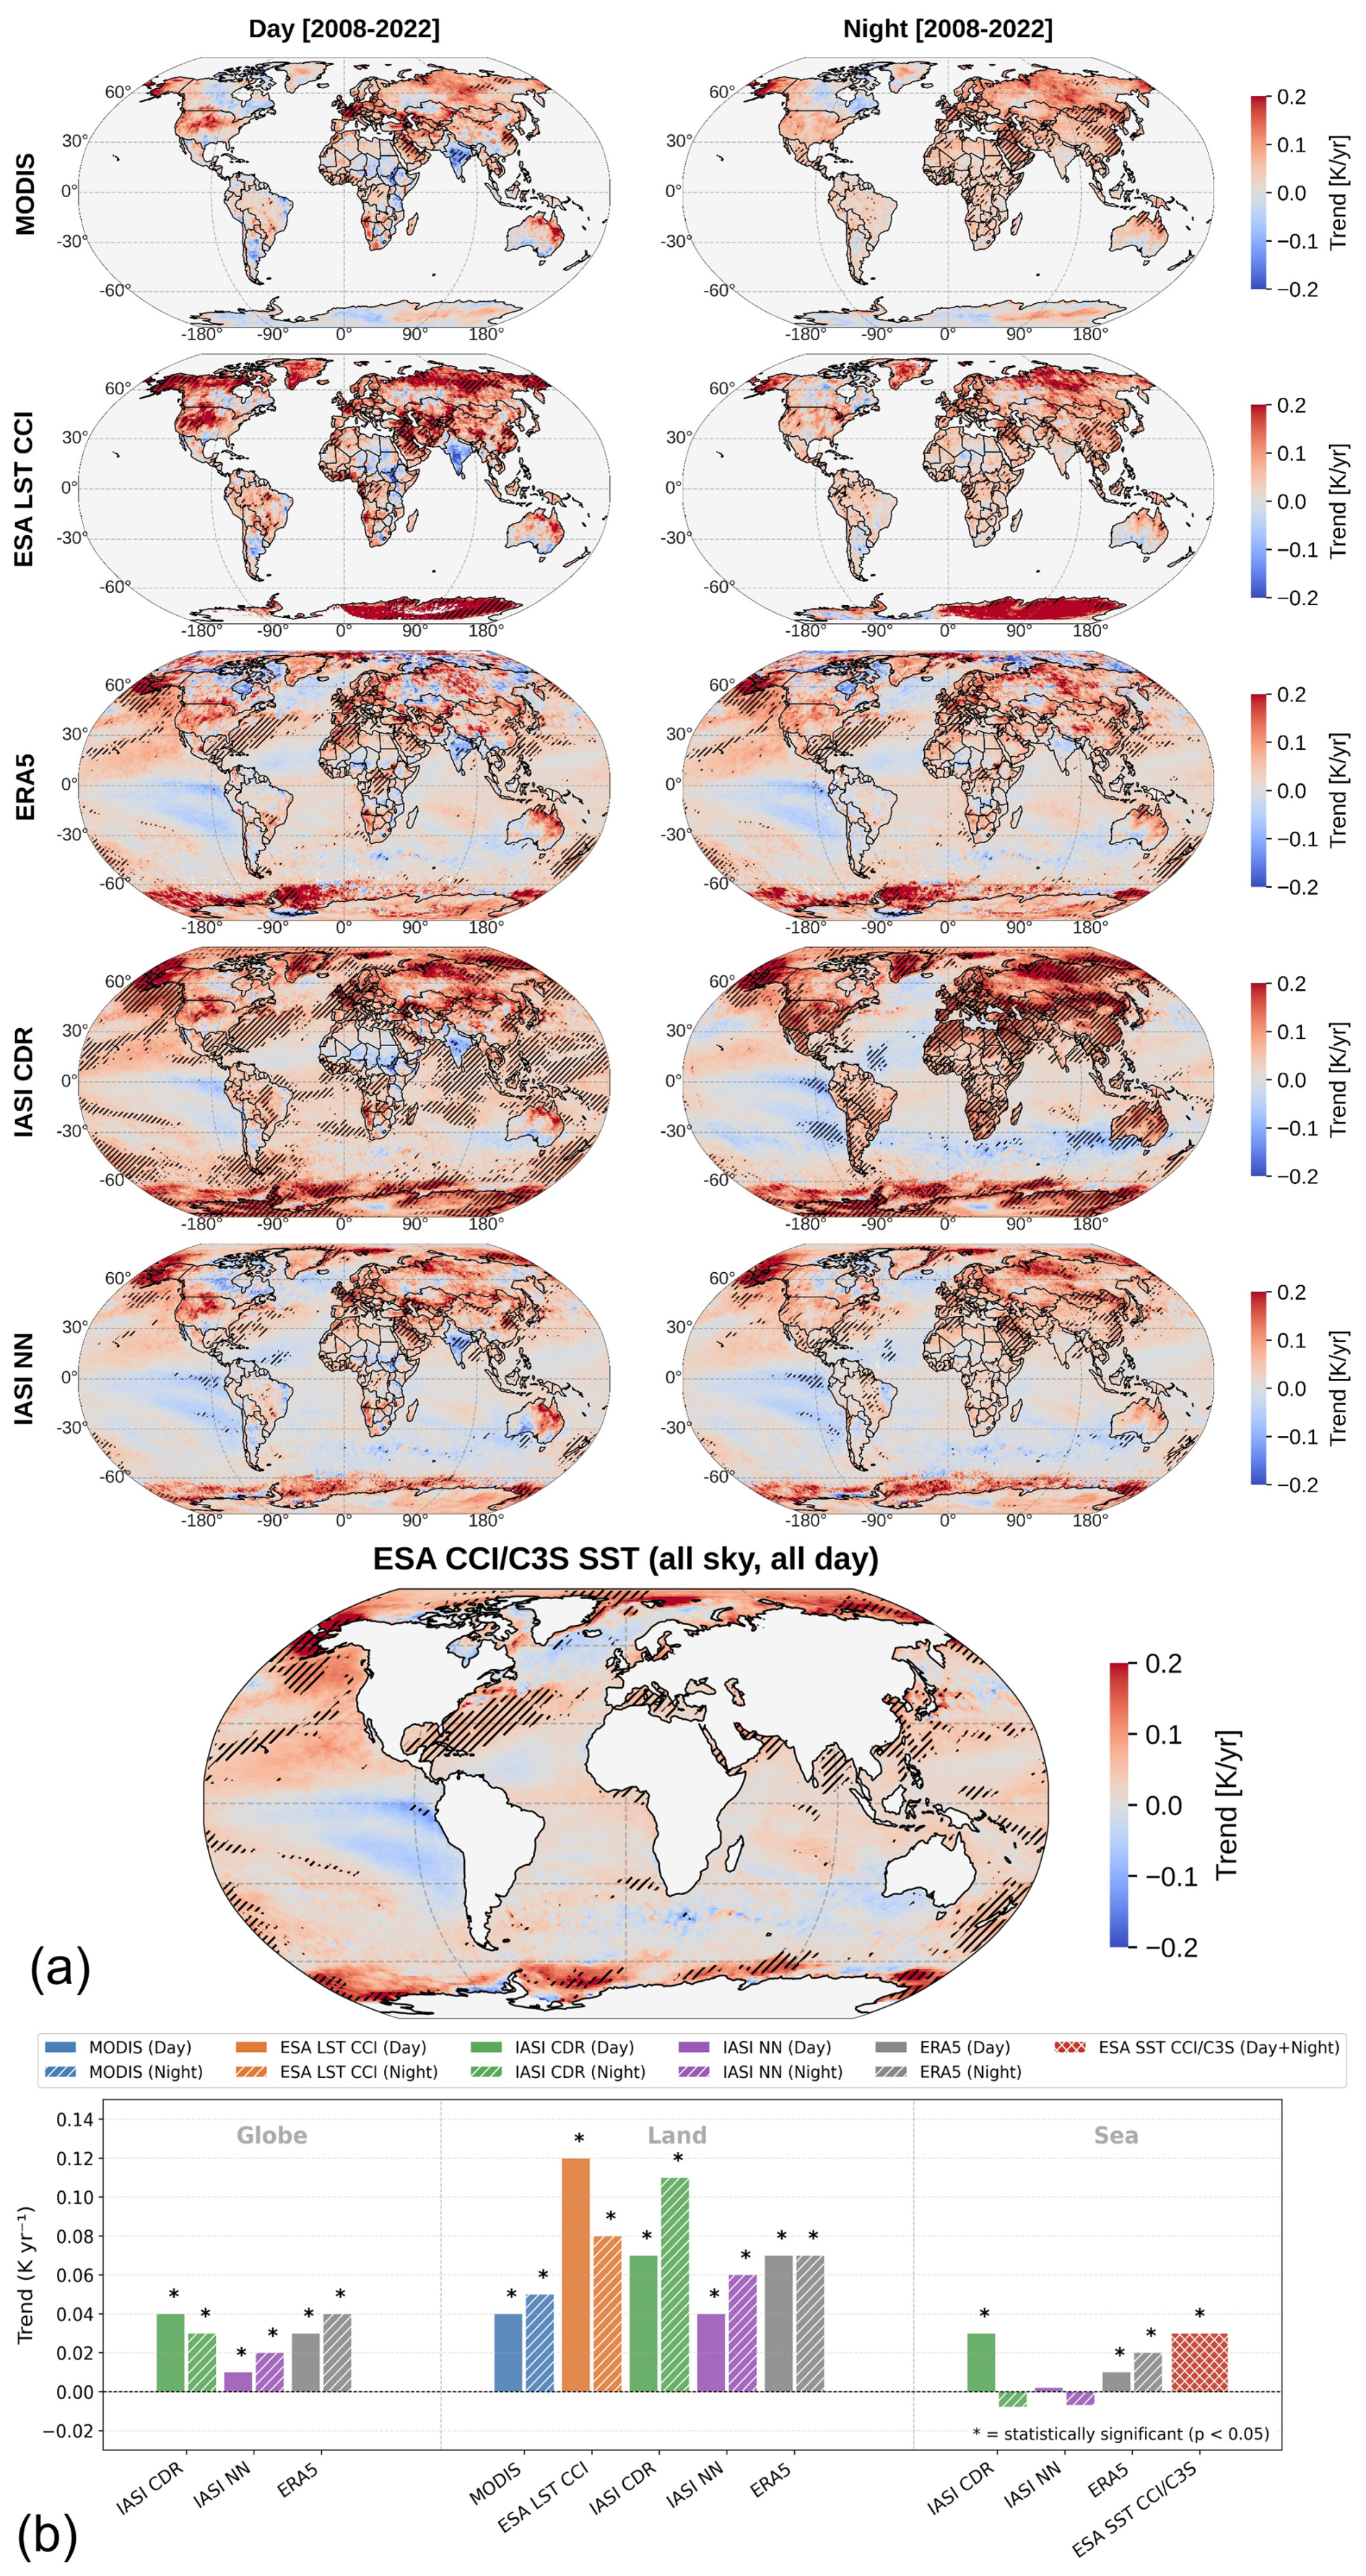
Figure 6(a) Spatial trends [K yr−1] during day (left column) and night (right column) for MODIS, ESACCI LST, ERA5, IASI-CDR, IASI-NN, and ESA CCI/C3S SST (all sky, all day) over the period January 2008–December 2022. Stipples correspond to regions where trends are significant according to the standard Mann-Kendall test (p-value < 0.05). (b) Global (Tskin), sea (SST), land (LST) trends (K yr−1) from MODIS, ESA CCI LST, IASI-CDR, IASI-NN, ERA5, and ESA CCI/C3S SST over the period [January 2008–December 2022]. Trends are computed with the Theil–Sen estimator on annual latitude-weighted and deseasonalised averages. Significant trends are marked with an Asterix (∗) above the bars.
Spatial distribution of trends from the different datasets are generally closely correlated. As climate change has a diurnal signature at different times of the day (Safieddine et al., 2025), we notice that for the same dataset, day and night trends are different, particularly over land, with daytime values more pronounced (positively or negatively). In the Northern Hemisphere (NH), over land and sea, all datasets show mostly positive trends with the strongest warming in Alaska and Siberia. Both observations and general circulation model projections suggest current and future significant temperature increases in Siberia consistent with the effects of Arctic amplification, with the Arctic warming nearly four times faster than the global average over 1979–2021 (Masson-Delmotte, et al., 2021; Rantanen et al., 2022). This broad Arctic warming pattern is consistent with the strong positive Tskin trends observed in Alaska and Siberia in our 2008–2022 dataset. While most of the NH hemisphere has positive trends, India shows negative trends during the day, for all the datasets studied. In fact, aerosol emissions over India continued to increase in the past two decades (2000–2019) (Klimont et al., 2013; Wang et al., 2021). Aerosol optical depths retrievals from satellites show positive trends over the 2000–2019 period over India (Quaas et al., 2022). The increase in aerosol load might therefore exert a cooling influence that offsets part of the greenhouse gas warming. Moreover, India is generally greening (Kuttippurath and Kashyap, 2023) and changing land use and land cover can increase heavy rainfall events (Boyaj et al., 2020); other studies suggest that climate change increases the frequency of extreme events and extreme rainfall (Easterling et al., 2000; Prathipati et al., 2019). Clouds have a dual impact on surface temperature by suppressing or accelerating the trends. Banerjee et al., 2022, found that the clouds' impact on surface temperature in India is season dependent and changes between day and night.
This cooling trend is also seen in central and east Africa. In warm tropical environments, increased cloud cover and latent heat release associated with more frequent and intense extreme rainfall events can suppress surface temperatures (Hegerl et al., 2007), providing a physical mechanism consistent with the observed cooling signal. In East Africa, drought under different climate scenarios follow the paradigm “dry get drier and wet gets wetter” with decreasing drought and skin temperatures particularly recorded in Kenya, Uganda, and Ethiopian highlands (Haile et al., 2020; Yang et al., 2019). In the Southern Pacific, close to the South America, negative Tskin/SST trends are observed in ERA5, IASI CDR, IASI NN, and the ESA CCI/C3S SST confined to/around the Humboldt Current System. Such localization strongly points to a wind-driven upwelling mechanism, as surface temperature in eastern boundary current systems is primarily controlled by alongshore winds, Ekman divergence, and the upwelling of cold subsurface waters. Strengthening of upwelling-favorable winds can therefore produce coastal cooling despite ongoing global ocean warming (Gutiérrez et al., 2011; Jebri et al., 2020). On the relatively short 2008–2022 period, internal Pacific decadal variability can further modulate these trends and project strongly onto the Peru–Chile upwelling region (Jebri et al., 2020).
The IASI-CDR shows more statistically significant trends, which is expected because the PWLR3 algorithm is a regression-based method. By design, it smooths short-term noise and inherits part of the temporal structure of its training dataset, producing a cleaner and more stable time series. As a result, long-term warming signals stand out more clearly, so more grid cells pass the significance test compared to fully independent retrievals, as IASI-NN dataset. The inclusion of time-varying CAMEL emissivities in the IASI-NN retrieval has implications for the derived LST trends. For example, Zhou et al. (2021) showed that neglecting emissivity trends leads to an overestimation of the global mean Tskin trend by approximately 4.9 × 10⁻³ K yr−1 (over the period 2008 to 2020). By explicitly incorporating monthly CAMEL emissivity fields and their interannual variability, the IASI-NN is therefore expected to yield more physically realistic LST trends than datasets relying on static emissivity climatology, such as ERA5
Figure 6b summarizes the mean trends for the six products across land, sea and land + sea (globe) and for daytime and nighttime conditions separately (except for ESA CCI/C3S SST which is a combined all sky, all day product). All trends are significant, except IASI-NN over sea, as well IASI-CDR at night, over the sea. Results show predominantly positive trends, though their magnitudes vary by region (globe, land or sea) and observing system. Land is heating at a much faster rate than the ocean (for all datasets). Over land, the five datasets report consistently positive for MODIS, IASI-CDR, IASI-NN, and ERA5. Daytime land values range from +0.04 to +0.12 K yr−1, with LST CCI showing the strongest daytime trend. Nighttime land trends range from +0.05 (MODIS) to +0.11 K yr−1, with IASI-CDR producing the largest positive trend and CCI the second one. Over the oceans, trends are weaker in magnitude. The ESA CCI/C3S SST, the only all-sky product, shows a small positive ocean trend (+0.03 K yr−1) consistent with IASI-CDR during the day and ERA5 during the night.
In Fig. S3, we show the latitude-dependent LST and SST trends (K yr−1) during day and night from the different datasets. Trends are averaged over all the longitudes and spatially weighted by cos(latitude). The trends reveal a broadly consistent latitudinal structure across all datasets. Over land, daytime and nighttime trends generally increase toward the Northern Hemisphere and at high northern and southern latitudes, the effect of the Arctic amplification is clear across all datasets. MODIS, ERA5, IASI CDR, IASI NN and ESA CCI/C3S SST show close agreement across most latitudes, while the LST CCI product diverges most strongly in the Southern Hemisphere high latitudes. Over the oceans, SST trends are more uniform across datasets.
In this study, we demonstrate how well satellite and reanalysis can be used to monitor the evolution of Earth's skin temperature (Tskin) – over both land and ocean, and separately for morning and evening overpasses – using a suite of complementary observing systems over 2008–2022. We intercompared MODIS Terra LST (v6.1), ERA5 skin temperature, the latest ESA LST CCI product (v3.00), the ESA CCI and C3S SST and IST L4 product, and two independent IASI-based retrievals: the EUMETSAT all-sky Climate Data Record (IASI-CDR, PWLR3) and a newly developed clear-sky neural-network product (IASI-NN). The datasets (except the ESA CCI/C3S SST and IST) were cloud filtered harmonized to comparable local times (∼ 09:30–10:30 LT) and a common 1° × 1° grid to assess each of the dataset consistency, anomalies/variability, and spatial trends. This work provides the first global, diurnally consistent intercomparison that simultaneously includes (1) the newly updated IASI-NN clear-sky product, (2) the homogeneously reprocessed IASI-CDR, and (3) the most recent ESA LST CCI v3.00 dataset, as well as MODIS, ERA5 and ESA CCI/C3S SST and IST products. Importantly, we assess day–night behaviour consistently across the datasets and across both land and ocean, enabling evaluation of the diurnal fingerprint of recent climate change from different datasets.
Over land, daytime global means agree within ∼ 2 K across datasets, and deseasonalised anomalies are highly consistent, indicating that the major modes of interannual variability are robustly captured. However, two systematic caveats affect absolute values and, potentially, trends. First, LST CCI v3.00 exhibits step changes at sensor transitions (AATSR → MODIS Terra → SLSTR-B), visible in anomalies and reflected in larger RMSE. These discontinuities indicate residual inhomogeneities that must be considered when using v3.00. Second, MODIS Terra shows a pervasive nighttime cold bias relative to all other products, including LST CCI (which ingests MODIS radiances but applies a distinct retrieval chain). The magnitude and spatial extent of the MODIS nighttime bias are larger than expected from small overpass-time differences alone, which might be explained with known sensitivities of MODIS LST to cloud screening and residual cloud contamination (Gallo and Krishnan, 2022; Williamson et al., 2013), as well as reported cold biases at high latitudes (Muster et al., 2015; Østby et al., 2014) and at in situ validation sites (Tan et al., 2021).
Over the ocean, inter-dataset biases are smaller than over land and generally remain below 1 K, with RMSE near ∼ 1 K. Discrepancies increase toward high latitudes, where cloud detection, sea-ice contamination, and reduced thermal contrast degrade infrared retrieval sensitivity (Whitburn et al., 2022). A further caveat concerns clear-sky sampling: the stronger negative IASI anomalies during the 2020–2022 La Niña partly reflect reduced clear-sky retrieval availability under increased tropical cloudiness, rather than a true surface cooling – a reminder that global-mean anomalies from clear-sky-filtered Tskin records can be modulated by cloud occurrence and sampling changes, and should be interpreted with this in mind when used as a climate indicator.
Spatial trend patterns over 2008–2022 are broadly consistent across datasets. All products show predominantly positive trends, stronger over land than ocean, and a clear signature of Arctic amplification at high northern latitudes, consistent with established evidence from observations and assessments (Masson-Delmotte et al., 2021). At regional scales, we robustly detect coherent areas of daytime cooling (e.g., India) and localized cooling in eastern boundary upwelling regions (e.g., the Peru–Chile/Humboldt system). The India signal is consistent with a combination of aerosol forcing, cloud radiative effects, and land-surface changes modulating the diurnal response (Banerjee et al., 2022; Klimont et al., 2013; Quaas et al., 2022; Wang et al., 2021). The southeastern Pacific cooling is physically consistent with wind-driven upwelling dynamics and modulation by internal decadal variability (Gutiérrez et al., 2011; Jebri et al., 2020). Over the sea, differences in trend magnitude remain dataset-dependent echoing recent findings that satellite-era SST trend estimates can differ consequentially across datasets (Menemenlis et al., 2025). Our results emphasize that uncertainty in surface temperature trends remains non-negligible and must be explicitly accounted for when using observations to constrain climate change.
This work illustrates the strong complementarity between different satellite sensors and model-based/reanalysis products for characterising climate variability in Tskin. With the current IASI constellation (including IASI-C) expected to operate at least until 2030, and the continuity ensured by the IASI-New Generation series launched in 2025 with an intended lifetime extending to around 2045, long and internally consistent Tskin time series will continue to grow in length and quality. This will open new opportunities for global and regional monitoring of climate change at different times of the day, over land and sea, from space.
Channels used to retrieve skin temperature from IASI (in order of Tskin information content): 1300, 1282, 1249, 1272, 1254, 1294, 1230, 1164, 1267, 1194, 1179, 1222, 1311, 1086, 1157, 1172, 1142, 1203, 1018, 1141, 1009, 1089, 1115, 1025, 1126, 1038, 1100, 1001, 1321, 1209, 1069, 997, 1070, 921, 962, 1051, 940, 916, 1114, 950, 869, 1237, 926, 961, 875, 979, 889, 899, 897, 1052, 853, 984, 862, 771, 759, 752, 797, 745, 775, 801, 714, 706, 698, 844, 726, 810, 736, 824, 691, 669, 661, 786, 827, 642, 650, 682, 582, 630, 625, 574, 584, 547, 551, 565, 534, 619, 521.
The datasets used in this study are available as follows:
-
IASI Artificial Neural Network skin temperature data: Metop A: https://doi.org/10.21413/IASI-FT_METOPA_SKT_L3_LATMOS-ULB (Safieddine, 2026a) and Metop B: https://doi.org/10.21413/IASI-FT_METOPB_SKT_L3_LATMOS-ULB (Safieddine, 2026b).
-
IASI EUMETSAT all sky data product: https://doi.org/10.15770/EUM_SEC_CLM_0063 (EUMETSAT, 2022).
-
The Modis TERRA MOD11C3 Version 6.1 LST data can be accessed through NASA's LP DAAC data portal: https://doi.org/10.5067/MODIS/MOD11C3.061 (Wan et al, 2021).
-
ERA5 Tskin is available at the climate data store: https://doi.org/10.24381/cds.f17050d7 (Copernicus Climate Change Service, 2023).
-
ESA LST CCI V3.00 is available at: https://doi.org/10.5285/e67b02b814bf4a78b9ec90b4259f0741 (Ghent et al., 2025).
-
ESA SST/IST CCI/C3S is available at: https://doi.org/10.48670/moi-00169 (E.U. Copernicus Marine Service Information, 2026).
-
The code to transform ERA5 from UTC to local time can be found here: https://github.com/sarahsafieddine/utc-to-local-time/tree/main (last access: 3 September 2026; https://doi.org/10.5281/zenodo.22281753, Safieddine, 2026c).
The supplement related to this article is available online at https://doi.org/10.5194/eo-1-59-2026-supplement.
SaS and SeS generated the figures and prepared the manuscript with contributions from all co-authors. JHL made available IASI EUMETSAT all sky data to co-authors. MDB provided input on the Tskin CDR, SW and LC provided input on the cloud cover used to generate the Tskin NN dataset. CC secured the funding. All authors reviewed the manuscript.
The contact author has declared that none of the authors has any competing interests.
Publisher's note: Copernicus Publications remains neutral with regard to jurisdictional claims made in the text, published maps, institutional affiliations, or any other geographical representation in this paper. The authors bear the ultimate responsibility for providing appropriate place names. Views expressed in the text are those of the authors and do not necessarily reflect the views of the publisher.
The IASI mission is a joint mission of Eumetsat and the Centre National d'Etudes Spatiales (CNES, France). The IASI L1 data are distributed in near real time by Eumetsat through the Eumetcast system distribution. The authors acknowledge the Aeris data infrastructure for providing the IASI L1C data.
The authors thank the Reviewers for their useful comments and the owners of the Tskin/LST and SST databases used in this study.
This research has been supported by the EU Horizon 2020 (grant no. 742909).
This paper was edited by Nemesio Rodriguez-Fernandez and reviewed by Joao Martins and two anonymous referees.
Balsamo, G., Beljaars, A., Scipal, K., Viterbo, P., van den Hurk, B., Hirschi, M., and Betts, A. K.: A Revised Hydrology for the ECMWF Model: Verification from Field Site to Terrestrial Water Storage and Impact in the Integrated Forecast System, J. Hydrometeorol., 10, 623–643, https://doi.org/10.1175/2008JHM1068.1, 2009.
Banerjee, A. K., Dutta, S., and Dey, S.: Contrasting impacts of net cloud radiative forcing on the surface temperature trends in India, Environ. Res. Commun., 4, 041005, https://doi.org/10.1088/2515-7620/ac52e0, 2022.
Bouillon, M., Safieddine, S., Hadji-Lazaro, J., Whitburn, S., Clarisse, L., Doutriaux-Boucher, M., Coppens, D., August, T., Jacquette, E., and Clerbaux, C.: Ten-Year Assessment of IASI Radiance and Temperature, Remote Sens., 12, 2393, https://doi.org/10.3390/rs12152393, 2020.
Boyaj, A., Dasari, H. P., Hoteit, I., and Ashok, K.: Increasing heavy rainfall events in south India due to changing land use and land cover, Q. J. Roy. Meteor. Soc., 146, 3064–3085, https://doi.org/10.1002/qj.3826, 2020.
Clerbaux, C., Boynard, A., Clarisse, L., George, M., Hadji-Lazaro, J., Herbin, H., Hurtmans, D., Pommier, M., Razavi, A., Turquety, S., Wespes, C., and Coheur, P.-F.: Monitoring of atmospheric composition using the thermal infrared IASI/MetOp sounder, Atmos. Chem. Phys., 9, 6041–6054, https://doi.org/10.5194/acp-9-6041-2009, 2009.
Copernicus Climate Change Service: ERA5 monthly averaged data on single levels from 1940 to present, Copernicus Climate Change Service (C3S) Climate Data Store (CDS) [data set], https://doi.org/10.24381/cds.f17050d7, 2023.
Donlon, C. J., Minnett, P. J., Gentemann, C., Nightingale, T. J., Barton, I. J., Ward, B., and Murray, M. J.: Toward Improved Validation of Satellite Sea Surface Skin Temperature Measurements for Climate Research, J. Climate, 15, 353–369, https://doi.org/10.1175/1520-0442(2002)015<0353:TIVOSS>2.0.CO;2, 2002.
Easterling, D. R., Meehl, G. A., Parmesan, C., Changnon, S. A., Karl, T. R., and Mearns, L. O.: Climate Extremes: Observations, Modeling, and Impacts, Science, 289, 2068–2074, https://doi.org/10.1126/science.289.5487.2068, 2000.
Embury, O., Merchant, C. J., Good, S. A., Rayner, N. A., Høyer, J. L., Atkinson, C., Block, T., Alerskans, E., Pearson, K. J., Worsfold, M., McCarroll, N., and Donlon, C.: Satellite-based time-series of sea-surface temperature since 1980 for climate applications, Sci. Data, 11, 326, https://doi.org/10.1038/s41597-024-03147-w, 2024.
Ermida, S. L. and Trigo, I. F.: A Comprehensive Clear-Sky Database for the Development of Land Surface Temperature Algorithms, Remote Sens., 14, 2329, https://doi.org/10.3390/rs14102329, 2022.
Ermida, S. L., Trigo, I. F., DaCamara, C. C., Jiménez, C., and Prigent, C.: Quantifying the Clear-Sky Bias of Satellite Land Surface Temperature Using Microwave-Based Estimates, J. Geophys. Res.-Atmos., 124, 844–857, https://doi.org/10.1029/2018JD029354, 2019.
E.U. Copernicus Marine Service Information (CMEMS): ESA SST CCI and C3S reprocessed sea surface temperature analyses, Marine Data Store (MDS) [data set], https://doi.org/10.48670/moi-00169, 2026.
EUMETSAT: IASI All Sky Temperature and Humidity Profiles – Climate Data Record Release 1.1 – Metop-A and -B, European Organisation for the Exploitation of Meteorological Satellites (EUMETSAT) [data set], https://doi.org/10.15770/EUM_SEC_CLM_0063, 2022.
Gallo, K. and Krishnan, P.: Evaluation of the Bias in the Use of Clear-Sky Compared with All-Sky Observations of Monthly and Annual Daytime Land Surface Temperature, J. Appl. Meteorol. Clim., 61, 1485–1495, https://doi.org/10.1175/JAMC-D-21-0240.1, 2022.
Ghent, D., Veal, K., and Perry, M.: ESA Land Surface Temperature Climate Change Initiative (LST_cci): Daily multisensor Infra-Red (IR) Low Earth Orbit (LEO) land surface temperature (LST) time series level 3 supercollated (L3S) global product (1995–2024), version 3.00, NERC EDS Centre for Environmental Data Analysis [data set], https://doi.org/10.5285/e67b02b814bf4a78b9ec90b4259f0741, 2025.
Graham, R. M., Hudson, S. R., and Maturilli, M.: Improved Performance of ERA5 in Arctic Gateway Relative to Four Global Atmospheric Reanalyses, Geophys. Res. Lett., 46, 6138–6147, https://doi.org/10.1029/2019GL082781, 2019.
Guillevic, P., Göttsche, F., Nickeson, J., Hulley, G., Ghent, D., Yu, Y., Trigo, I., Hook, S., Sobrino, J. A., Remedios, J., Román, M., and Camacho, F.: Land Surface Temperature Product Validation Best Practice Protocol Version 1.1 – January 2018, Committee on Earth Observation Satellites (CEOS) Working Group on Calibration and Validation (WGCV) Land Product Validation (LPV) subgroup, NASA, USA, https://doi.org/10.5067/doc/ceoswgcv/lpv/lst.001, 2018., 2018.
Gutiérrez, D., Bouloubassi, I., Sifeddine, A., Purca, S., Goubanova, K., Graco, M., Field, D., Méjanelle, L., Velazco, F., Lorre, A., Salvatteci, R., Quispe, D., Vargas, G., Dewitte, B., and Ortlieb, L.: Coastal cooling and increased productivity in the main upwelling zone off Peru since the mid-twentieth century, Geophys. Res. Lett., 38, https://doi.org/10.1029/2010GL046324, 2011.
Hachem, S., Duguay, C. R., and Allard, M.: Comparison of MODIS-derived land surface temperatures with ground surface and air temperature measurements in continuous permafrost terrain, The Cryosphere, 6, 51–69, https://doi.org/10.5194/tc-6-51-2012, 2012.
Haile, G. G., Tang, Q., Hosseini-Moghari, S.-M., Liu, X., Gebremicael, T. G., Leng, G., Kebede, A., Xu, X., and Yun, X.: Projected Impacts of Climate Change on Drought Patterns Over East Africa, Earths Future, 8, e2020EF001502, https://doi.org/10.1029/2020EF001502, 2020.
Hegerl, G. C., Crowley, T. J., Allen, M., Hyde, W. T., Pollack, H. N., Smerdon, J., and Zorita, E.: Detection of Human Influence on a New, Validated 1500-Year Temperature Reconstruction, J. Climate, 20, 650–666, https://doi.org/10.1175/JCLI4011.1, 2007.
Herrmannsdörfer, L., Müller, M., Shupe, M. D., and Rostosky, P.: Surface temperature comparison of the Arctic winter MOSAiC observations, ERA5 reanalysis, and MODIS satellite retrieval, Elem. Sci. Anth., 11, 00085, https://doi.org/10.1525/elementa.2022.00085, 2023.
Hersbach, H., Bell, B., Berrisford, P., Hirahara, S., Horányi, A., Muñoz-Sabater, J., Nicolas, J., Peubey, C., Radu, R., Schepers, D., Simmons, A., Soci, C., Abdalla, S., Abellan, X., Balsamo, G., Bechtold, P., Biavati, G., Bidlot, J., Bonavita, M., Chiara, G. D., Dahlgren, P., Dee, D., Diamantakis, M., Dragani, R., Flemming, J., Forbes, R., Fuentes, M., Geer, A., Haimberger, L., Healy, S., Hogan, R. J., Hólm, E., Janisková, M., Keeley, S., Laloyaux, P., Lopez, P., Lupu, C., Radnoti, G., Rosnay, P. de, Rozum, I., Vamborg, F., Villaume, S., and Thépaut, J.-N.: The ERA5 global reanalysis, Q. J. Roy. Meteor. Soc., 146, 1999–2049, https://doi.org/10.1002/qj.3803, 2020.
Hirahara, S., Alonso-Balmaseda, M., de Boisseson, E., and Hersbach, H.: Sea Surface Temperature and Sea Ice Concentration for ERA5, ECMWF, https://www.ecmwf.int/en/elibrary/16555-sea-surface-temperature-and-sea-ice-concentration-era5 (last access: 3 September 2026), 2016.
Høyer, J. L. and She, J.: Optimal interpolation of sea surface temperature for the North Sea and Baltic Sea, J. Marine Syst., 65, 176–189, https://doi.org/10.1016/j.jmarsys.2005.03.008, 2007.
Høyer, J. L., Le Borgne, P., and Eastwood, S.: A bias correction method for Arctic satellite sea surface temperature observations, Remote Sens. Environ., 146, 201–213, https://doi.org/10.1016/j.rse.2013.04.020, 2014.
Hulley, G. C., Ghent, D., Göttsche, F. M., Guillevic, P. C., Mildrexler, D. J., and Coll, C.: 3 – Land Surface Temperature, in: Taking the Temperature of the Earth, edited by: Hulley, G. C. and Ghent, D., Elsevier, 57–127, https://doi.org/10.1016/B978-0-12-814458-9.00003-4, 2019.
Jebri, B., Khodri, M., Echevin, V., Gastineau, G., Thiria, S., Vialard, J., and Lebas, N.: Contributions of Internal Variability and External Forcing to the Recent Trends in the Southeastern Pacific and Peru–Chile Upwelling System, J. Climate, 33, 10555–10578, https://doi.org/10.1175/JCLI-D-19-0304.1, 2020.
Kendall, M. G.: Rank Correlation Methods, 4th edn., Charles Griffin, London, ISBN 9780852641996, 1975.
Khadka, A., Wagnon, P., Brun, F., Shrestha, D., Lejeune, Y., and Arnaud, Y.: Evaluation of ERA5-Land and HARv2 Reanalysis Data at High Elevation in the Upper Dudh Koshi Basin (Everest Region, Nepal), J. Appl. Meteorol. Clim., 61, 931–954, https://doi.org/10.1175/JAMC-D-21-0091.1, 2022.
Kilymis, D., Kangah, Y., Le Barbier, L., Jacquette, E., Lenot, X., Ansart, J., Faillot, M., Calvel, J.-C., Codou, G., and Vandermarcq, O.: IASI global radiometric uncertainty budget, Atmos. Meas. Tech., 18, 6513–6525, https://doi.org/10.5194/amt-18-6513-2025, 2025.
Klimont, Z., Smith, S. J., and Cofala, J.: The last decade of global anthropogenic sulfur dioxide: 2000–2011 emissions, Environ. Res. Lett., 8, 014003, https://doi.org/10.1088/1748-9326/8/1/014003, 2013.
Kuttippurath, J. and Kashyap, R.: Greening of India: Forests or Croplands?, Appl. Geogr., 161, 103115, https://doi.org/10.1016/j.apgeog.2023.103115, 2023.
Liu, Z.-H., Weng, S.-S., Zeng, Z.-L., Ding, M.-H., Wang, Y.-Q., and Liang, Z.: Hourly land surface temperature retrieval over the Tibetan Plateau using Geo-LightGBM framework: Fusion of Himawari-8 satellite, ERA5 and site observations, Advances in Climate Change Research, 15, 623–635, https://doi.org/10.1016/j.accre.2024.06.007, 2024.
Mann, H. B.: Nonparametric Tests Against Trend, Econometrica, 13, 245–259, 1945.
Masson-Delmotte, V., Zhai, P., Pirani, A., Connors, S. L., Péan, C., Berger, S., Caud, N., Chen, Y., Goldfarb, L., Gomis, M. I., Huang, M., Leitzell, K., Lonnoy, E., Matthews, J. B. R., Maycock, T. K., Waterfield, T., Yelekçi, O., Yu, R., and Zhou, B.: IPCC, 2021: Climate Change 2021: The Physical Science Basis. Contribution of Working Group I to the Sixth Assessment Report of the Intergovernmental Panel on Climate Change, Cambridge University Press, Cambridge, United Kingdom and New York, NY, USA, https://doi.org/10.1017/9781009157896, 2021.
Menemenlis, S., Vecchi, G. A., Yang, W., Fueglistaler, S., and Raghuraman, S. P.: Consequential differences in satellite-era sea surface temperature trends across datasets, Nat. Clim. Chang., 15, 897–903, https://doi.org/10.1038/s41558-025-02362-6, 2025.
Minnett, P. J., Alvera-Azcárate, A., Chin, T. M., Corlett, G. K., Gentemann, C. L., Karagali, I., Li, X., Marsouin, A., Marullo, S., Maturi, E., Santoleri, R., Saux Picart, S., Steele, M., and Vazquez-Cuervo, J.: Half a century of satellite remote sensing of sea-surface temperature, Remote Sens. Environ., 233, 111366, https://doi.org/10.1016/j.rse.2019.111366, 2019.
Muster, S., Langer, M., Abnizova, A., Young, K. L., and Boike, J.: Spatio-temporal sensitivity of MODIS land surface temperature anomalies indicates high potential for large-scale land cover change detection in Arctic permafrost landscapes, Remote Sens. Environ., 168, 1–12, https://doi.org/10.1016/j.rse.2015.06.017, 2015.
Nielsen-Englyst, P., Høyer, J. L., Kolbe, W. M., Dybkjær, G., Lavergne, T., Tonboe, R. T., Skarpalezos, S., and Karagali, I.: A combined sea and sea-ice surface temperature climate dataset of the Arctic, 1982–2021, Remote Sens. Environ., 284, 113331, https://doi.org/10.1016/j.rse.2022.113331, 2023.
Østby, T. I., Schuler, T. V., and Westermann, S.: Severe cloud contamination of MODIS Land Surface Temperatures over an Arctic ice cap, Svalbard, Remote Sens. Environ., 142, 95–102, https://doi.org/10.1016/j.rse.2013.11.005, 2014.
Prathipati, V. K., Naidu, C. V., and Konatham, P.: Inconsistency in the frequency of rainfall events in the Indian summer monsoon season, Int. J. Climatol., 39, 4907–4923, https://doi.org/10.1002/joc.6113, 2019.
Prigent, C., Jimenez, C., and Aires, F.: Toward “all weather,” long record, and real-time land surface temperature retrievals from microwave satellite observations, J. Geophys. Res.-Atmos., 121, 5699–5717, https://doi.org/10.1002/2015JD024402, 2016.
Quaas, J., Jia, H., Smith, C., Albright, A. L., Aas, W., Bellouin, N., Boucher, O., Doutriaux-Boucher, M., Forster, P. M., Grosvenor, D., Jenkins, S., Klimont, Z., Loeb, N. G., Ma, X., Naik, V., Paulot, F., Stier, P., Wild, M., Myhre, G., and Schulz, M.: Robust evidence for reversal of the trend in aerosol effective climate forcing, Atmos. Chem. Phys., 22, 12221–12239, https://doi.org/10.5194/acp-22-12221-2022, 2022.
Rantanen, M., Karpechko, A. Y., Lipponen, A., Nordling, K., Hyvärinen, O., Ruosteenoja, K., Vihma, T., and Laaksonen, A.: The Arctic has warmed nearly four times faster than the globe since 1979, Commun. Earth Environ., 3, 1–10, https://doi.org/10.1038/s43247-022-00498-3, 2022.
Rhee, J., Im, J., and Carbone, G. J.: Monitoring agricultural drought for arid and humid regions using multi-sensor remote sensing data, Remote Sens. Environ., 114, 2875–2887, https://doi.org/10.1016/j.rse.2010.07.005, 2010.
Safieddine, S.: IASI-FT Skin Temperature (from IASI/Metop-A) version 202407, LATMOS/ULB [data set], https://doi.org/10.21413/IASI-FT_METOPA_SKT_L3_LATMOS-ULB, 2026a.
Safieddine, S.: IASI-FT Skin Temperature (from IASI/Metop-B) version 202407, LATMOS/ULB [data set], https://doi.org/10.21413/IASI-FT_METOPB_SKT_L3_LATMOS-ULB, 2026b.
Safieddine, S.: sarahsafieddine/utc-to-local-time: With DOI (Version addedDOI), Zenodo [code], https://doi.org/10.5281/zenodo.22281753, 2026c.
Safieddine, S., Parracho, A. C., George, M., Aires, F., Pellet, V., Clarisse, L., Whitburn, S., Lezeaux, O., Thépaut, J.-N., Hersbach, H., Radnoti, G., Göettsche, F.-M., Martin, M. A., Doutriaux-Boucher, M., Coppens, D., August, T., Zhou, D. K., and Clerbaux, C.: Artificial Neural Networks to Retrieve Land and Sea Skin Temperature from IASI, Remote Sens., 12, 2777, https://doi.org/10.3390/rs12172777, 2020.
Safieddine, S., Clerbaux, C., Muñoz-Sabater, J., and Thépaut, J.-N.: Local hourly trends in near-surface and land surface temperatures, Sci. Rep., 15, 29915, https://doi.org/10.1038/s41598-025-15731-0, 2025.
Sen, P. K.: Estimates of the Regression Coefficient Based on Kendall's Tau, J. Am. Stat. Assoc., 63, 1379–1389, https://doi.org/10.1080/01621459.1968.10480934, 1968.
Tan, J., Che, T., Wang, J., Liang, J., Zhang, Y., and Ren, Z.: Reconstruction of the Daily MODIS Land Surface Temperature Product Using the Two-Step Improved Similar Pixels Method, Remote Sens., 13, 1671, https://doi.org/10.3390/rs13091671, 2021.
Theil, H.: A Rank-Invariant Method of Linear and Polynomial Regression Analysis, in: Henri Theil's Contributions to Economics and Econometrics: Econometric Theory and Methodology, edited by: Raj, B. and Koerts, J., Springer Netherlands, Dordrecht, 345–381, https://doi.org/10.1007/978-94-011-2546-8_20, 1992.
Wan, Z.: New refinements and validation of the collection-6 MODIS land-surface temperature/emissivity product, Remote Sens. Environ., 140, 36–45, https://doi.org/10.1016/j.rse.2013.08.027, 2014.
Wan, Z., Hook, S., and Hulley, G.: MODIS/Terra Land Surface Temperature/Emissivity Monthly L3 Global 0.05Deg CMG V061, NASA Land Processes Distributed Active Archive Center [data set], https://doi.org/10.5067/MODIS/MOD11C3.061, 2021.
Wang, Y.-R., Hessen, D. O., Samset, B. H., and Stordal, F.: Evaluating global and regional land warming trends in the past decades with both MODIS and ERA5-Land land surface temperature data, Remote Sens. Environ., 280, 113181, https://doi.org/10.1016/j.rse.2022.113181, 2022.
Wang, Z., Lin, L., Xu, Y., Che, H., Zhang, X., Zhang, H., Dong, W., Wang, C., Gui, K., and Xie, B.: Incorrect Asian aerosols affecting the attribution and projection of regional climate change in CMIP6 models, npj Clim. Atmos. Sci., 4, 1–8, https://doi.org/10.1038/s41612-020-00159-2, 2021.
Whitburn, S., Clarisse, L., Crapeau, M., August, T., Hultberg, T., Coheur, P. F., and Clerbaux, C.: A CO2-independent cloud mask from Infrared Atmospheric Sounding Interferometer (IASI) radiances for climate applications, Atmos. Meas. Tech., 15, 6653–6668, https://doi.org/10.5194/amt-15-6653-2022, 2022.
Williamson, S. N., Hik, D. S., Gamon, J. A., Kavanaugh, J. L., and Koh, S.: Evaluating Cloud Contamination in Clear-Sky MODIS Terra Daytime Land Surface Temperatures Using Ground-Based Meteorology Station Observations, J. Climate, 26, 1551–1560, https://doi.org/10.1175/JCLI-D-12-00250.1, 2013.
Yang, T., Ding, J., Liu, D., Wang, X., and Wang, T.: Combined Use of Multiple Drought Indices for Global Assessment of Dry Gets Drier and Wet Gets Wetter Paradigm, J. Climate, 32, 737–748, https://doi.org/10.1175/JCLI-D-18-0261.1, 2019.
Yoo, C., Im, J., Cho, D., Lee, Y., Bae, D., and Sismanidis, P.: Downscaling MODIS nighttime land surface temperatures in urban areas using ASTER thermal data through local linear forest, Int. J. Appl. Earth Obs., 110, 102827, https://doi.org/10.1016/j.jag.2022.102827, 2022.
Zeng, X. and Beljaars, A.: A prognostic scheme of sea surface skin temperature for modeling and data assimilation, Geophys. Res. Lett., 32, https://doi.org/10.1029/2005GL023030, 2005.
Zhai, Z., Wang, Y., Reijmer, C. H., Smeets, P. C. J. P., Zhang, X., and Zhang, W.: MODIS land surface temperature in East Antarctica: accuracy and its main affecting factors, J. Glaciol., 70, e22, https://doi.org/10.1017/jog.2024.17, 2024.
Zhou, D. K., Larar, A. M., and Liu, X.: Surface Skin Temperature and Its Trend Observations From IASI on Board MetOp Satellites, IEEE J. Sel. Top. Appl., 14, 1665–1675, https://doi.org/10.1109/JSTARS.2020.3046421, 2021.
Zhou, L., Dickinson, R. E., Tian, Y., Jin, M., Ogawa, K., Yu, H., and Schmugge, T.: A sensitivity study of climate and energy balance simulations with use of satellite-derived emissivity data over Northern Africa and the Arabian Peninsula, J. Geophys. Res.-Atmos., 108, https://doi.org/10.1029/2003JD004083, 2003.
- Abstract
- Introduction
- Methods
- Cross-Platform Assessment of Surface Temperature Products
- LST/Tskin trends over the period [Jan 2008- Dec 2022]
- Conclusions and discussions
- Appendix A
- Code and data availability
- Author contributions
- Competing interests
- Disclaimer
- Acknowledgements
- Financial support
- Review statement
- References
- Supplement
- Abstract
- Introduction
- Methods
- Cross-Platform Assessment of Surface Temperature Products
- LST/Tskin trends over the period [Jan 2008- Dec 2022]
- Conclusions and discussions
- Appendix A
- Code and data availability
- Author contributions
- Competing interests
- Disclaimer
- Acknowledgements
- Financial support
- Review statement
- References
- Supplement