
the Creative Commons Attribution 4.0 License.
the Creative Commons Attribution 4.0 License.
 | 25 Sep 2026
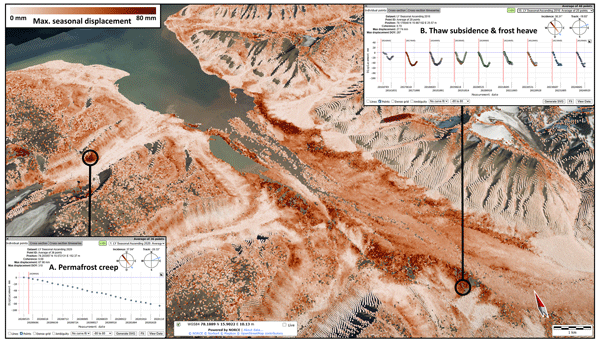
Brief communication: InSAR Svalbard Ground Motion Service – observing surface displacements in the High Arctic
Marie Bredal

Lotte Wendt
Heidi Hindberg
Daniel Stødle
Tom Rune Lauknes
Jelte van Oostveen
Yngvar Larsen
Gökhan Aslan
Emma Hauglin
John Dehls
Anja Sundal
Anna Odh
Dag Anders Moldestad
The InSAR Svalbard Ground Motion Service (GMS) provides open-access surface displacement maps and time series in the Svalbard archipelago, derived from Sentinel-1 Interferometric Synthetic Aperture Radar (InSAR). The service provides seasonal products capturing short-term 2016–2024 displacements and interannual products documenting long-term 2018–2024 velocity trends. InSAR Svalbard covers five areas on Spitsbergen Island (Longyearbyen, Ny-Ålesund, Svea, Hornsund and Kapp Linné). The service consists in a web-based visualisation tool at https://svalbard.insar.no/ (release date: 2 February 2026, last access: 22 September 2026). The products are also distributed at https://doi.org/10.5281/zenodo.18442696 (Bredal et al., 2026a). InSAR Svalbard establishes a foundation for geohazard assessment in Arctic regions and interdisciplinary research on permafrost dynamics, ground stability, and environmental changes.
- Article
(5936 KB) - Full-text XML
- BibTeX
- EndNote


Spaceborne Interferometric Synthetic Aperture Radar (InSAR) is an established tool used to measure ground motion caused by natural and anthropogenic processes. InSAR is especially valuable in remote and harsh environments such as permafrost regions in polar and high-mountain settings, where in-situ measurements are logistically challenging and costly to acquire (Zwieback et al., 2024). Since its launch in 2014, the Copernicus Sentinel-1 satellite mission has provided C-band radar imagery with a global coverage, a consistent acquisition strategy, and a short revisit time (6–12 d). Thanks to its open data policy, the mission has enabled the development of operational InSAR Ground Motion Services (GMS) for the large-scale documentation of surface displacement. In Norway, the InSAR Norway service has provided nationwide, open-access InSAR data since 2018 at https://insar.no/ (last access: 22 September 2026). At the continental scale, comparable datasets are available through the European Ground Motion Service (EGMS) at https://egms.land.copernicus.eu (last access: 22 September 2026). However, neither service currently covers the Svalbard archipelago. The cold climate and the perennially frozen ground (permafrost) lead to challenging surficial conditions to process InSAR (snow, wetness), and heterogenous and nonlinear deformation patterns, which require alternative processing strategies compared to the temperate mainland.
Svalbard has a long history of geoscientific and geoengineering research (Humlum et al., 2003). However, surface movement and periglacial landforms have not been consistently mapped across the archipelago. Satellite remote sensing has the potential to fill this gap thanks to operational missions with large spatial coverage and regular image acquisition. Previous InSAR studies in Svalbard have demonstrated the potential of the technique for mapping geohazards, inferring ground frost-susceptibility and ice content, and documenting seasonal freeze–thaw cycles using subsidence–heave time series (Rouyet et al., 2019; Wendt et al., 2026). Comparable investigations conducted in other Arctic regions further demonstrate the growing application of InSAR for both hazard management and permafrost research (Scheer et al., 2023; Zwieback and Meyer, 2021). However, most previous studies have focused on small areas, short time periods, and/or targeted applications, resulting in datasets that are spatially and temporally fragmented. A consistently processed and open-access InSAR GMS tailored to cold-climate environments has so far been lacking. The InSAR Svalbard GMS aims to fill this gap by providing displacement products for both research and operational use in the High Arctic. The development phase of the service spanned three years and included several rounds of interaction between InSAR experts and end-users throughout the design and implementation phases (see Acknowledgements) to define the user requirements and product specifications (Rouyet et al., 2024). In this paper, we briefly introduce the properties of the first InSAR Svalbard data release at https://svalbard.insar.no/ (Bredal et al., 2026a).
Svalbard is a dynamic High Arctic environment where glacial, periglacial, fluvial, and anthropogenic processes continuously shape the landscape and influence ground stability. Approximately 60 % of the archipelago is covered by glaciers, while most of the remaining terrain is underlain by permafrost beneath an active layer that freezes and thaws seasonally (Hanssen-Bauer et al., 2019). The Arctic is warming three to four times faster than the global average and Svalbard is among the fastest-warming Arctic regions. Consequently, permafrost temperature and active layer thickness are also increasing (Strand and Christiansen, 2025). Such rapid warming leads to major environmental changes and enhanced ground dynamics. Permafrost degradation can result in an increased frequency, magnitude, and velocity of mass movement, as well as long-term subsidence caused by ground ice melting (Streletskiy et al., 2025).
Svalbard hosts a rich cultural heritage and diverse present-day human activities. Unstable ground conditions pose a threat to historical sites, modern infrastructure, and population at the main settlements, research stations, and tourist destinations (Nicu et al., 2026). Mapping surface displacement is therefore relevant for hazard assessment and management. In addition, Svalbard is a key location for many polar and climate science disciplines due to its unique climatic and environmental setting. Because the ground dynamics respond to environmental drivers, systematically measured displacement time series have the potential to serve as climate change indicators (Duchossois et al., 2018).
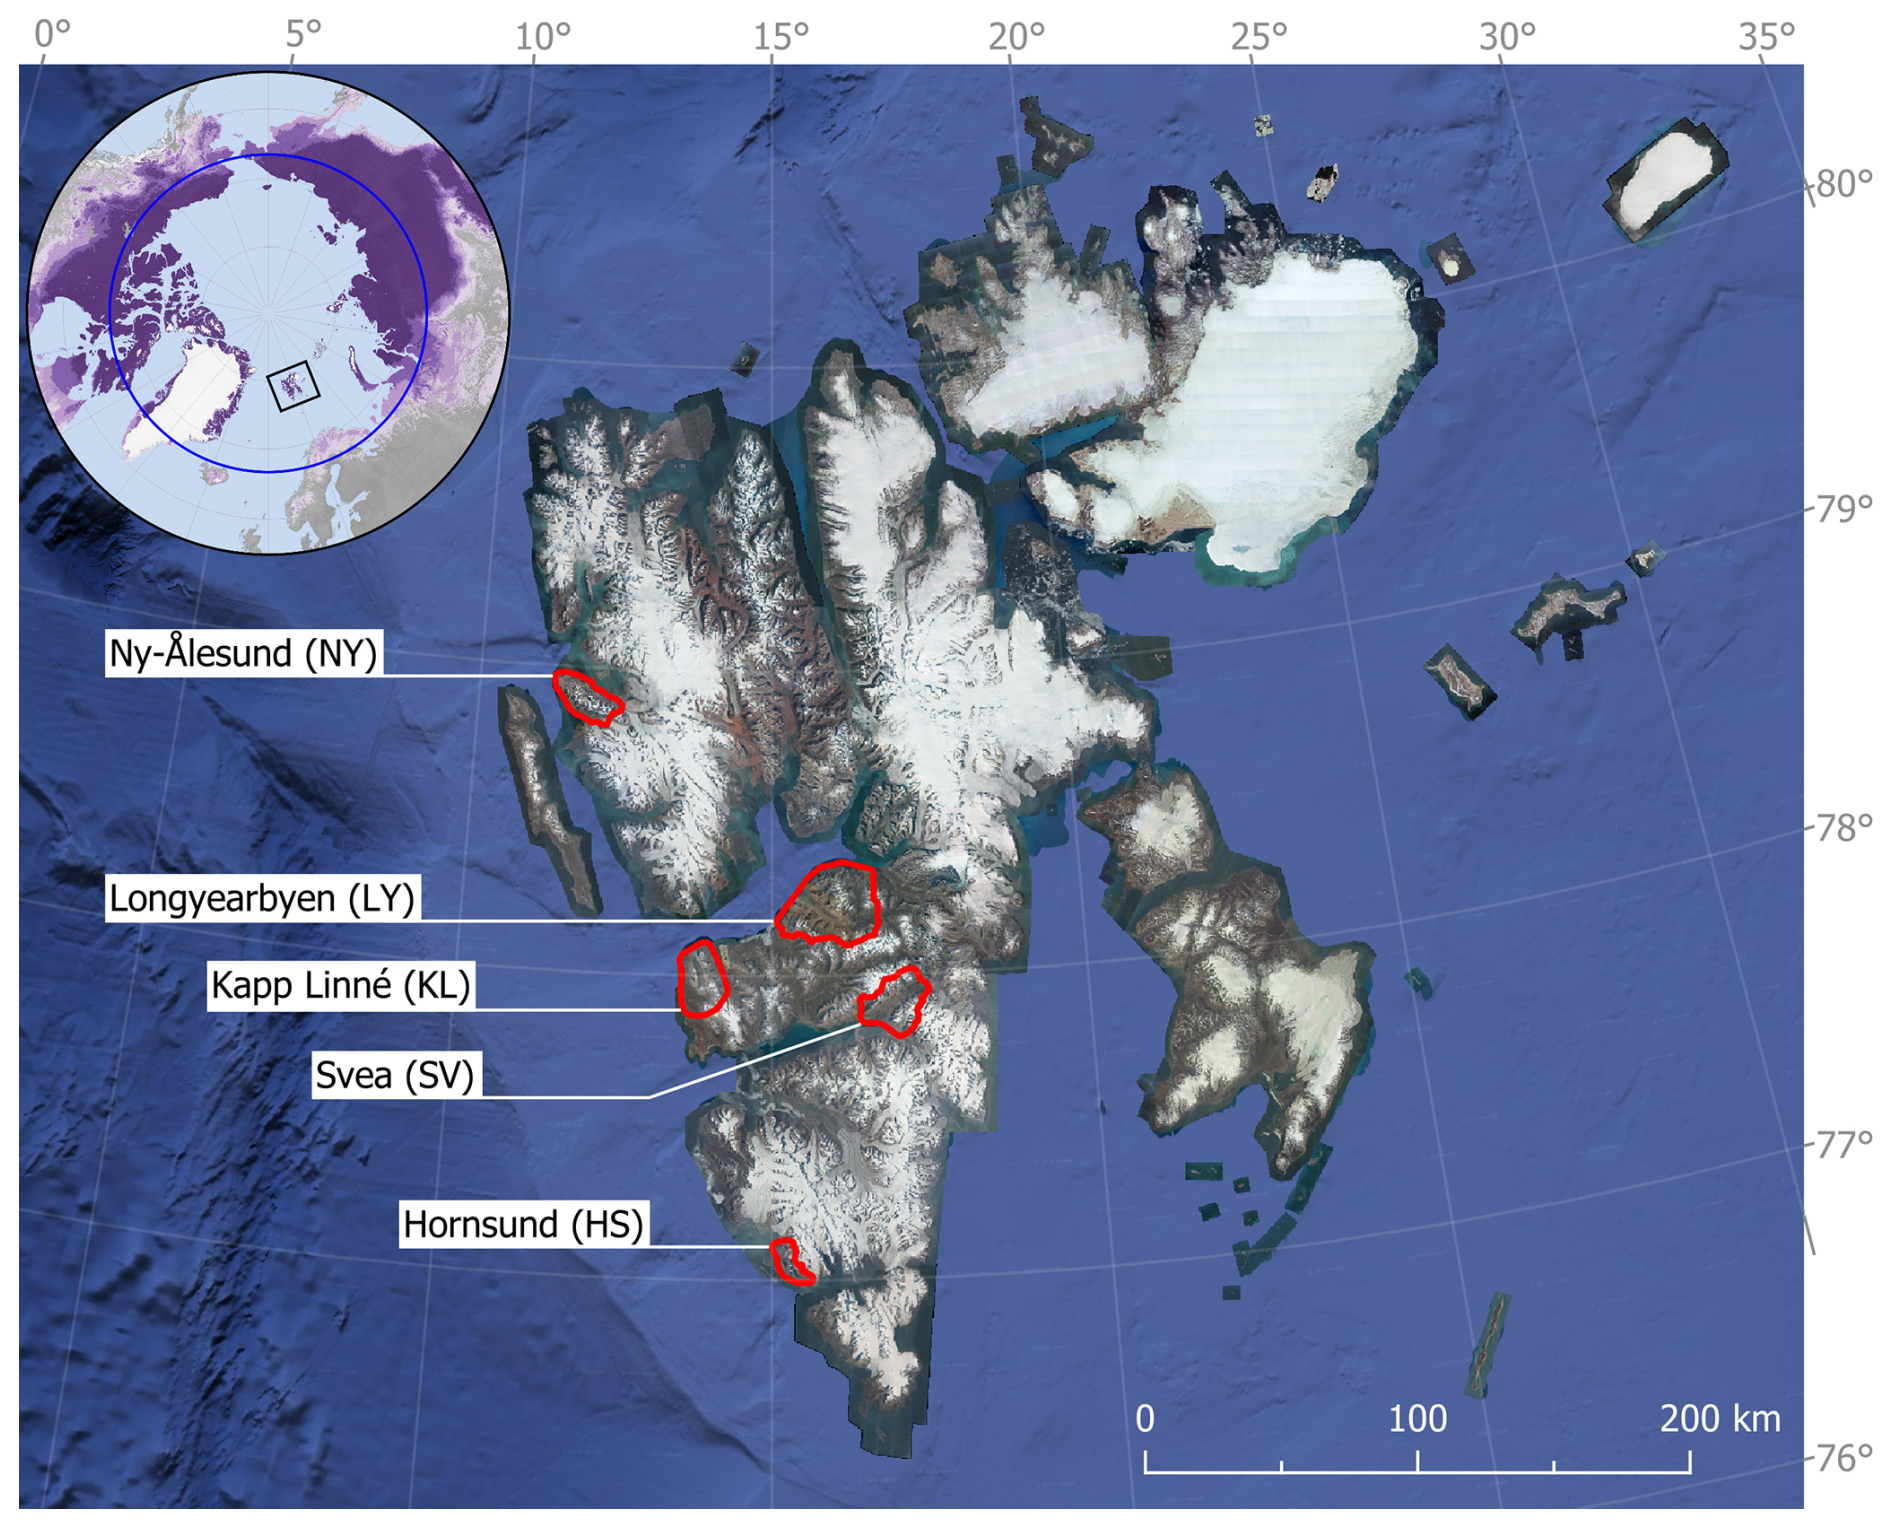
Figure 1Overview of the five InSAR Svalbard study areas: Longyearbyen (LY), Ny-Ålesund (NY), Svea (SV), Hornsund (HS) and Kapp Linné (KL). Background maps: Svalbard Orthophoto (NPI, 2026) and Google Satellite Orthoimages (map data © 2026 Google). The circular polar-centred map in the upper left corner shows the location of Svalbard (black rectangle) in the northern hemisphere (> 55° latitude). The blue line shows the Arctic circle (66°34′). The purple shades show the permafrost distribution, from continuous (dark purple) to isolated (light purple) zones, based on modelled results from Obu et al. (2019).
The InSAR Svalbard pilot products are available for five study areas on Spitsbergen Island: Longyearbyen (LY), Ny-Ålesund (NY), Kapp Linné (KL), Svea (SV) and Hornsund (HS) (Fig. 1). These areas were selected due to their societal and scientific relevance, as they include the main Norwegian settlements, research stations, tourist destinations and cultural heritage sites (Rouyet et al., 2024).
InSAR Svalbard results are based on C-band Synthetic Aperture Radar (SAR) data acquired by the Copernicus Sentinel-1 satellites, operating at a wavelength of ∼ 5.6 cm. Interferometric SAR (InSAR) exploits the phase of the radar signal, which is proportional to the two-way travel path between the satellite sensor and the ground. By differencing the phase of two satellite images acquired at different times, it is possible to measure changes in the sensor-to-ground distance along the radar line-of-sight (LOS). Such phase differences are represented by interferograms. By combining multiple interferograms, cumulative displacement time series can be estimated.
We used Sentinel-1 SAR images acquired in the Interferometric Wide (IW) swath mode from track 14A (ascending geometry) and track 154D (descending geometry). Only images from the snow-free periods were processed, because snow causes decorrelation of the phase signal. There are gaps in winter, and the observation time window varies each year due to variable climatic conditions. The documented season typically spans from June to October (at best, from late May to early December). The images are selected with a data-driven approach based on signal stability metrics (interferometric coherence). To reduce the noise, a spatial multi-looking factor of 8 × 2 (range × azimuth) was applied to the IW images, resulting in a final ground resolution of ∼ 30 m. The temporal resolution corresponds to the satellite's revisit interval: 6 d during dual-satellite operation (2017–2021); 12 d before fall 2016 and after the Sentinel-1B failure in December 2021.
The InSAR Svalbard products were generated using a Distributed Scatterer InSAR approach, based on a Small Baseline Subset (SBAS) algorithm (Berardino et al., 2002). The SBAS approach uses a network of interferograms selected according to predefined spatial and temporal baseline thresholds to minimize geometric and temporal decorrelation. By combining multiple, partially overlapping interferograms, the method increases redundancy, which reduces atmospheric noise and improves the accuracy of the displacement estimates. The processing workflow includes removal of orbital and topographic phase components, filtering to reduce speckle noise and atmospheric effects, phase calibration, interferogram unwrapping, SBAS inversion and geocoding. Overall, it followed the same steps applied to past Svalbard InSAR case studies (Rouyet et al., 2019; Wendt et al., 2026). Details about the processing settings, product properties and related limitations are available in the InSAR Svalbard user manual (see Chaps. 2, 3 and 5 in Bredal et al., 2026b).
Two complementary SBAS processing strategies were applied to generate two types of InSAR Svalbard products, capturing both short-term (seasonal) and long-term (interannual) surface displacement patterns. The SBAS workflow is similar, but the time intervals used to build the interferometric pairs vary to capture ground dynamics across multiple timescales.
The seasonal products document cumulative short-term surface displacements within each snow-free period. The time series span 2016–2024 for products based on images acquired with an ascending orbit, and 2018–2024 for products based on images acquired with a descending orbit. Over Svalbard, Sentinel-1 IW images were unavailable before 2018 in the descending geometry. Interferograms were generated using image pairs with short time intervals (6–48 d). Each season was processed separately. Potential movement occurring before the start date is not captured and any ongoing long-term trends are not reflected in these results. The time series were used to extract the maximum seasonal displacement and the timing of this maximum displacement. The seasonal products are well suited for identifying rapid changes (up to a couple of decimetres) that occur within a single snow-free season, such as active layer dynamics or slope movement.
The interannual products document cumulative long-term surface displacements occurring between consecutive snow-free periods. The time series span 2018–2024 for both ascending and descending products, to provide an easily comparable period.
Interferograms were generated using image pairs separated by approximately one year (340–390 d). These products are not intended to document seasonal patterns. The time series were used to estimate the interannual mean velocity along the LOS. The products enable the documentation of slow, gradual displacement patterns over multiple years (up to a couple of cm yr−1), e.g., subsidence from permafrost degradation, heave from ice aggradation, or downslope movement from permafrost creep.
For both products, various filtering techniques have been applied to discard low-quality pixels, irrelevant signals and areas likely to be affected by unwrapping errors and phase ambiguities (Sect. 2.2 in Bredal et al., 2026b).
4.1 Seasonal InSAR Svalbard results
The seasonal InSAR Svalbard results provide an information about the distribution of the seasonal ground surface dynamics. By default, the InSAR Svalbard maps display the maximum seasonal displacement expressed in mm. Each documented pixel includes a comprehensive cumulative displacement time series within each seasonal observation time window (Fig. 2). The users can change the visualisation settings and interact with the data according to their needs. All WebGIS functions, e.g. tools to average and plot time series, are described in the InSAR Svalbard user manual (Chap. 4 in Bredal et al., 2026b). Advice for interpretation, e.g. explanations on the spatio-temporal variability in the data coverage and quality, are also provided (Chap. 5 in Bredal et al., 2026b).
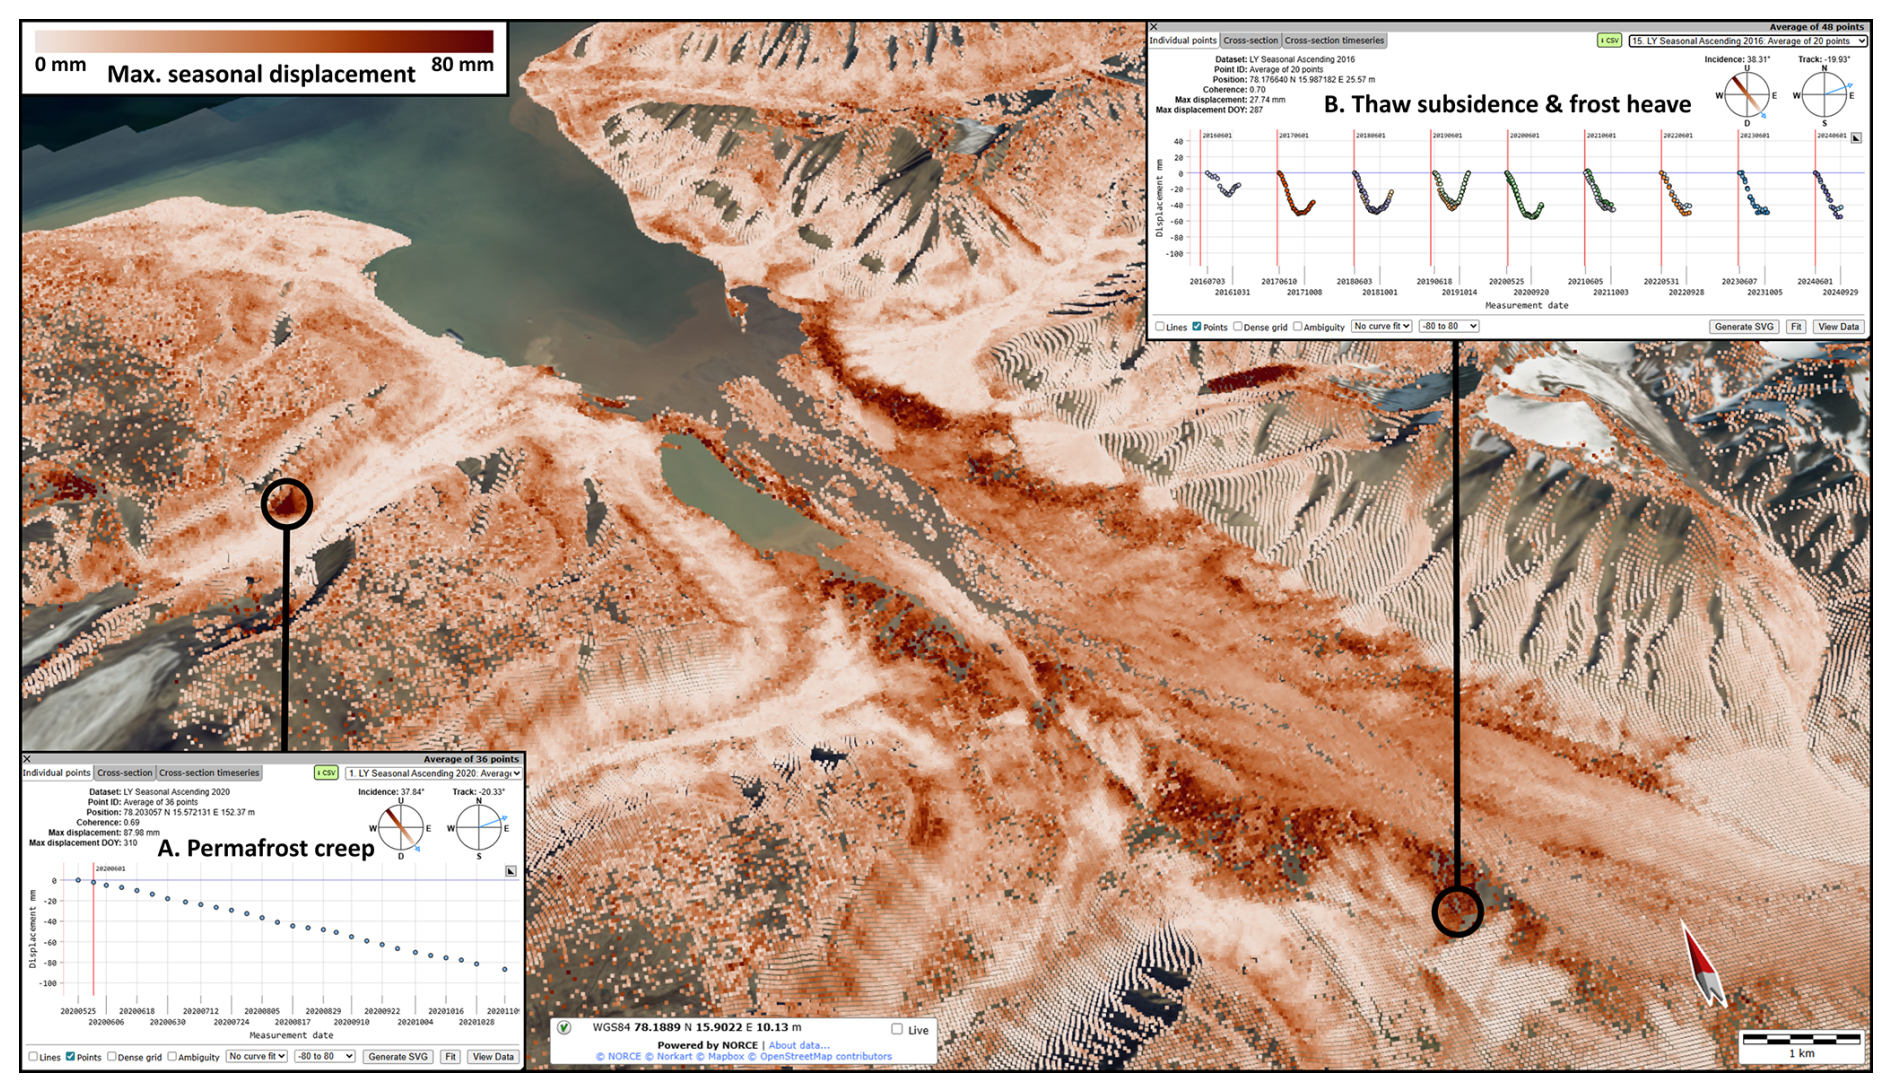
Figure 2Example of seasonal InSAR Svalbard results in the Longyearbyen (LY) study area. The map displays the maximum seasonal displacement expressed in mm (here for 2020, using an ascending SAR geometry). (A) When analysing one SAR geometry and one season, the seasonal time series provide information on the short-term displacement pattern during the spring–fall snow-free period (here on a rock glacier). (B) When all seasons and geometries are viewed all together, the time series provide information about the magnitude and timing of the displacement patterns during multiple seasons (here cyclic subsidence–heave patterns in an ice-rich part of the Advent valley). The results are shown in the InSAR Svalbard WebGIS tool. Background: Svalbard Orthophoto (NPI, 2026).
On slopes, the magnitude of the observed maximal displacements varies due to the large diversity of periglacial landforms in the study areas (e.g., solifluction sheets, rock glaciers, rock slope instabilities, debris-covered glaciers, etc.). InSAR Svalbard products can contribute to map and inventory the distribution and kinematic characteristics of such landforms at the regional scale. The results can also be used to perform a detailed analysis of the seasonal displacement time series for selected landforms and specific seasons (Fig. 2A).
In flat terrain, such as in valley bottoms filled with sediments (Fig. 2B), the magnitude of the observed maximal displacements is highly variable, depending on the sediment frost susceptibility (Rouyet et al., 2019). Such information can be used as a proxy to map the distribution of the ground ice content (Wendt et al., 2026; Zwieback and Meyer, 2021). The time series show various levels of cyclic subsidence and heave patterns during the periods when the active layer is thawing and refreezing (Fig. 2B). The timing of the transition between the subsidence and heave patterns provides a proxy of the seasonal freeze-onset, for years with little snow-covered surface in the fall (Rouyet et al., 2019).
4.2 Interannual InSAR Svalbard results
The interannual InSAR Svalbard results are complementary to the seasonal products. Spatially, they provide an information about the distribution of the ground surface dynamics at an interannual scale, allowing the identification of areas affected by long-term changes. By default, the InSAR Svalbard maps display the interannual velocity trends in mm yr−1. Each documented pixel includes a cumulative displacement time series ranging from 2018 to 2024 (Fig. 3). The users can change the visualisation settings and interact with the data according to their needs. All WebGIS functions, e.g. tools to select and compare time series at several locations, are described in the InSAR Svalbard user manual (Chap. 4 in Bredal et al., 2026b). Advice for interpretation, e.g. explanations on the key differences with the seasonal products, are also provided (Chap. 5 in Bredal et al., 2026b).
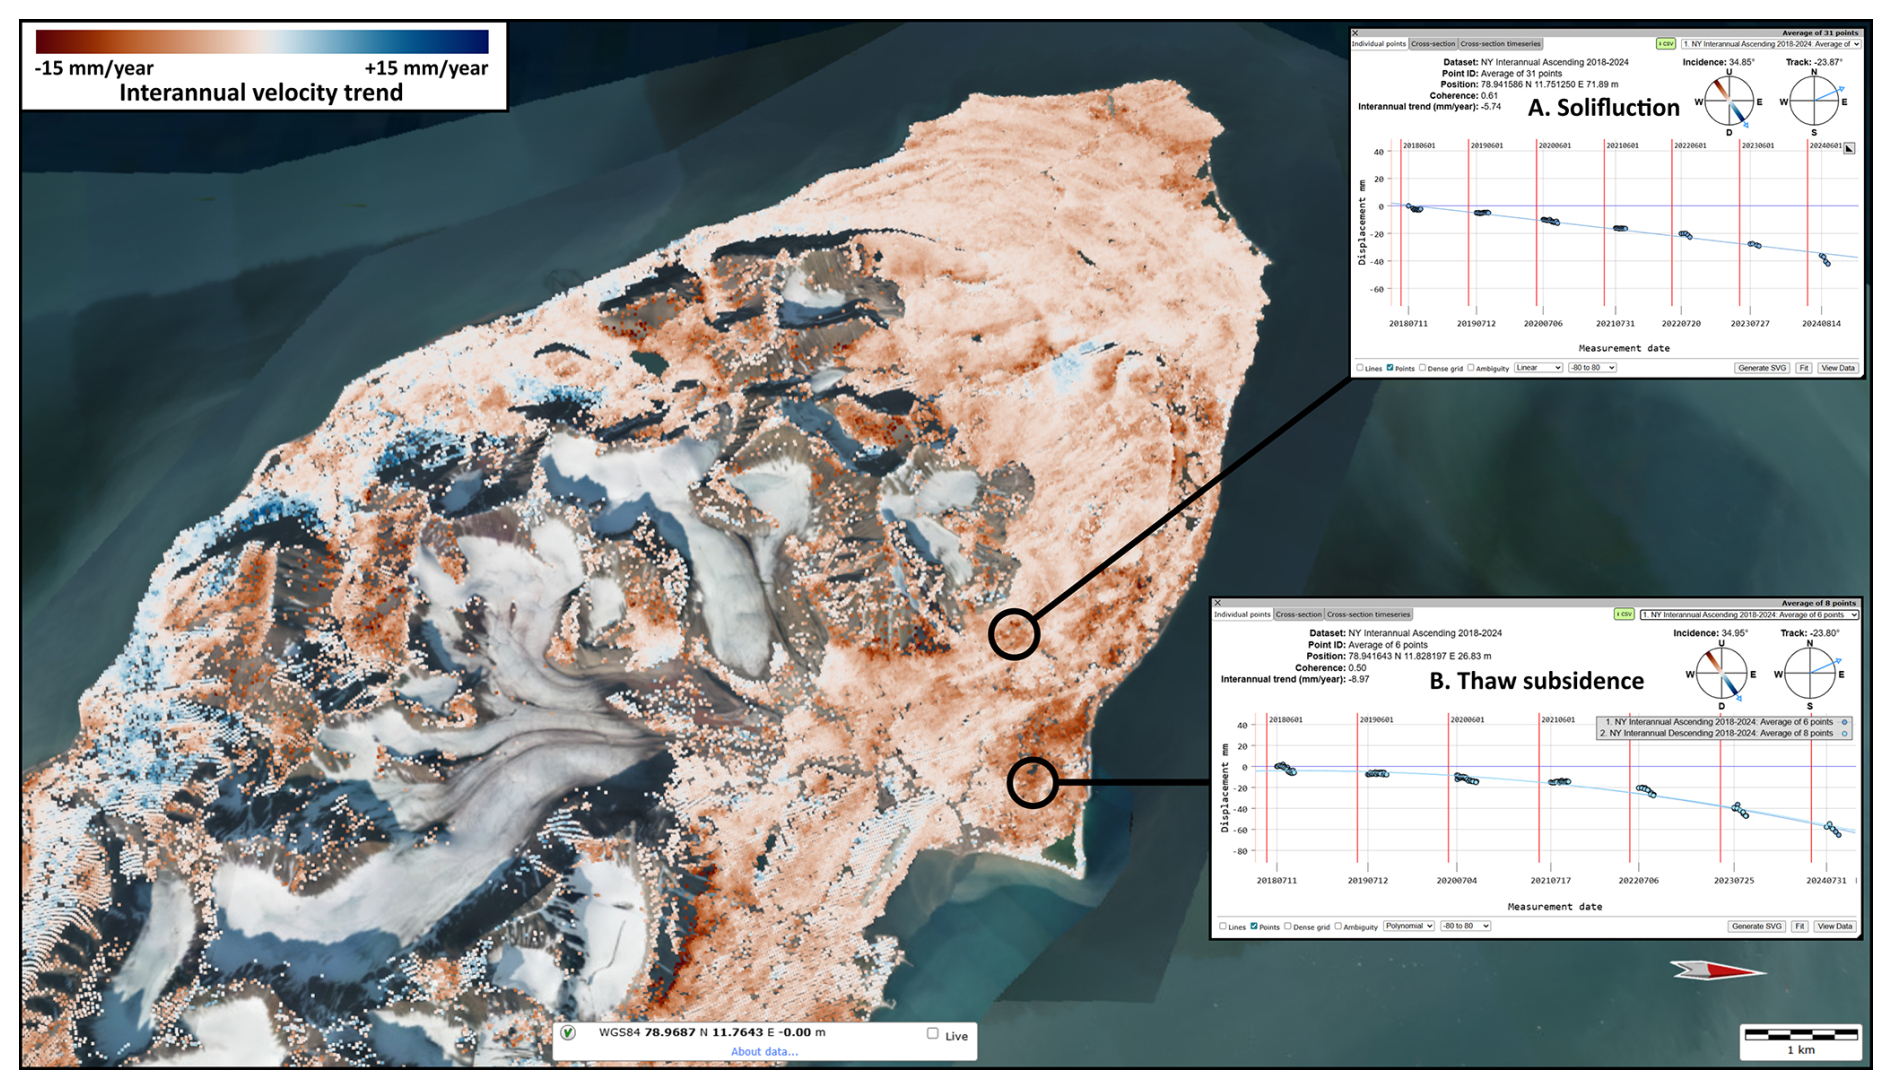
Figure 3Example of interannual InSAR Svalbard results in the Ny-Ålesund (NY) study area. The map displays the mean annual velocity expressed in mm yr−1 (here for 2018–2024 using an ascending SAR geometry). (A) The interannual displacement time series provide information on long-term gradual displacements occurring on mountain slopes (here due to solifluction). (B) In flat terrain, the results provide information on interannual changes of surface levels (here accelerating thaw subsidence, likely due to top-of-permafrost ice melt). The results are shown in the InSAR Svalbard WebGIS tool. Background: Svalbard Orthophoto (NPI, 2026).
On slopes, fast-moving landforms, such as rock glaciers or debris-covered glaciers are likely to be decorrelated due to the long time intervals used to generate the interferometric pairs (see Sect. 3). However, slow and gradual displacement patterns over multiple years (up to a couple of cm yr−1) can be documented, for instance on solifluction sheets or lobes (Fig. 3A).
In flat terrain, such as in lowland coastal areas (Fig. 3B), the results highlight similar spatially variability as the seasonal products, due to the contrasting sediment types, frost susceptibilities and ground ice contents. However, due the different timescale, the interannual changes are representing different processes, such as long-term subsidence due to ice melt at the top of the permafrost (Fig. 3B). The time series allows to identify and differentiate areas depicting relatively linear patterns from those affected by accelerating or decelerating trends. Such results can contribute to understand the evolution of landforms affected by permafrost degradation or aggregation (Liu et al., 2015; Samsonov et al., 2016) and further support the assessment of hazard potentially threatening modern infrastructure and cultural heritage sites (Nicu et al., 2026).
During the three first years of the InSAR Svalbard development phase, we focused on collecting user requirements, defining the product specifications and designing the web-based 3D visualisation tool. This phase is ending with the first release of InSAR Svalbard pilot products in five study areas at https://svalbard.insar.no. The data has the potential to support several operational and research activities. Relevant applications of the current InSAR Svalbard products include (non-exhaustive list of examples):
-
Detection, mapping and monitoring of thaw subsidence and frost heave patterns to better understand the state and evolution of the active layer and permafrost.
-
Detection, mapping and monitoring of slow-moving slope processes (e.g., landslides, rock glaciers, solifluction).
-
Estimation of the spatial distribution of the ground ice content and the changes in water balance.
-
Assessment of terrain stability for land-use planning and infrastructure management.
-
Hazard assessment and prioritisation of mitigation measures for cultural heritage sites and polluted areas.
-
Mapping of glacier forefields and monitoring of geomorphic adjustments in recently deglaciated areas.
InSAR Svalbard is designed as a long-term service rather than a static data release. The WebGIS will be regularly updated as new Sentinel-1 images are becoming available. In the next years, the development is expected to continue to upscale the production to cover more areas in the Svalbard archipelago. New products may also become available. Currently, InSAR Svalbard relies on Sentinel-1 images, but future data sources will be explored. Particularly, the use of L-band SAR, thanks to the new NISAR mission, a NASA and ISRO collaboration, and the upcoming ESA Copernicus Sentinel-12 mission ROSE-L, could enhance InSAR applications in Svalbard. L-band SAR is valuable to improve signal stability over complex surfaces and increase the maximum detectable velocity to study fast-moving processes. However, coverage limitations (NISAR has a left-looking SAR configuration and only covers up to 77.5° N) and mission schedules (ROSE-L is expected to launch earliest in 2028) necessitate exploring alternative data sources in the coming years. To maximise the societal and scientific value of InSAR Svalbard, several future tasks are planned in the coming years:
-
Refinement of processing routines and filtering thresholds, for reducing uncertainties and designing sustainable strategies for automated production at larger scale.
-
Expansion of study areas toward full Svalbard coverage, enabling comparison of several regions with diverse geological, topographic and climatic characteristics.
-
Adjustment of product types and potential development of complementary products, based on user feedback and accounting for various needs.
-
Data validation and interpretation, by comparing the products with complementary datasets, such as in-situ meteorological and permafrost measurements, geological maps, or geodetic measurements from in-situ data or optical remote sensing.
-
Further development of the training material and documentation of use cases to enhance user uptake among local stakeholders, national authorities and polar researchers.
InSAR Svalbard provides a robust foundation for long-term ground motion observations in the archipelago. As new Sentinel-1 images get available and other satellite missions become operational, the platform might evolve into a flexible, service-oriented system supporting research, hazard assessment, and sustainable land-use planning in Svalbard. On the way further, we hope InSAR Svalbard may contribute to setting a baseline for the development of similar InSAR services tailored for polar conditions and permafrost terrain (Duchossois et al., 2024). Developing a pan-Arctic GMS especially designed for cold-climate conditions could complement the existing continental services less suited for such challenging environments.
The data are openly available in the Zenodo repository at https://doi.org/10.5281/zenodo.18442696 (Bredal et al., 2026a), where all products are distributed as CSV files. The products can be viewed in the InSAR Svalbard GMS web portal at https://svalbard.insar.no (release date: 02 February 2026, last access: 22 September 2026).
MB – Conceptualisation, Investigation, Funding acquisition, Project administration, Supervision, Visualisation, Writing – original draft. LR – Conceptualisation, Data Curation, Formal analysis, Funding acquisition, Investigation, Methodology, Project administration, Software, Supervision, Visualisation, Writing – original draft. LW – Conceptualisation, Data Curation, Formal analysis, Investigation, Methodology, Software, Writing – review and editing. HH – Data Curation, Software, Writing – review and editing. DS – Data Curation, Software, Visualisation, Writing – review and editing. TRL – Data Curation, Software, Writing – review and editing. JvO – Software, Writing – review and editing. YL – Software, Writing – review and editing. GA – Project administration, Writing – review and editing. EH – Project administration, Writing – review and editing. JD – Funding acquisition, Resources, Writing – review and editing. AS – Project administration, Writing – review and editing. AO – Project administration, Writing – review and editing DAM – Project administration, Writing – review and editing.
The contact author has declared that none of the authors has any competing interests.
Publisher's note: Copernicus Publications remains neutral with regard to jurisdictional claims made in the text, published maps, institutional affiliations, or any other geographical representation in this paper. The authors bear the ultimate responsibility for providing appropriate place names. Views expressed in the text are those of the authors and do not necessarily reflect the views of the publisher.
The InSAR Svalbard development project (2023–2025) included many rounds of interactions between InSAR experts and end-users throughout its design and implementation phases. Several user workshops and surveys were organised to define the product specifications, gather feedback on test products and discussed adjusted versions. We acknowledge the involvement of key institutions and local stakeholders in Svalbard, which help defining the user requirements. We are especially grateful to the representatives from the Governor of Svalbard, the Longyearbyen Community Council, Store Norske Spitsbergen Kulkompani, Avinor, the Norwegian Polar Institute, the Norwegian Meteorological Institute, the University Centre in Svalbard, the Norwegian Geotechnical Institute and SINTEF AS. We acknowledge all participants of the three InSAR Svalbard workshops (summer 2023, fall 2024 and fall 2025) for their questions and feedback, which contributed to improve the product specifications and the service functionalities (in alphabetic order): Elisabeth Angell, Annett Bartsch, Jostein Børve Hernes, Hanne H. Christiansen, Justyna Dudek, Sonia Dupuis, Morag Fotheringham, Regula Frauenfelder, William Harcourt, Jörg Haarpaintner, Arne Instanes, Ketil Isaksen, Shridhar Jawak, Malte Jochmann, Lene Kristensen, Andreas Kääb, Pierre-Marie Lefeuvre, Matthieu Leydier, Vigdis Lonar, Eystein Markusson, Geir Moholdt, Ashley Morris, Mariann Nilssen, Kjersti Olsen Ingero, Maria Peter, Virve Ravolainen, Lillian Risvaag, Lena Rubensdotter, Thomas Schellenberger, Erik Schytt Mannerfelt, Monika Serafinska, Anatoly Sinitsyn, Martin Skedsmo, Huw Thomas Mithan, Alma Thuestad, Marjolaine Verret, Hannah Vickers, Maaike Weerdesteijn, Sebastian Westermann, Clarissa Willmes, and Duan Zheng.
The InSAR Svalbard Development Project (2023–2025) has been funded by the Norwegian Space Agency (NoSA) (Post 74, contract 74CO2301) and the Geological Survey of Norway (NGU). Recent research on InSAR in Svalbard and its use for permafrost science and geohazard assessment have also been supported by the European Space Agency (ESA) Climate Change Initiative (CCI) Permafrost project (grant no. 4000123681/18/I-NB) and the Fram Centre PermaRICH project (Norwegian Ministry of Climate and Environment, Chap. 1747, Post 70).
This paper was edited by Andrea Manconi and reviewed by two anonymous referees.
Berardino, P., Fornaro, G., Lanari, R., and Sansosti, E.: A new algorithm for surface deformation monitoring based on small baseline differential SAR interferograms, IEEE Trans. Geosci. Remote Sens., 40, 2375–2383, https://doi.org/10.1109/TGRS.2002.803792, 2002.
Bredal, M., Rouyet, L., Wendt, L., Hindberg, L., Stødle, D., Lauknes, T. R., Aslan, G., Hauglin, E., Dehls, J., Sundal, A., and Moldestad, D. A.: InSAR Svalbard Ground Motion Service: Observing Surface Displacements in the High Arctic, Zenodo [data set], https://doi.org/10.5281/zenodo.18442696, 2026a.
Bredal, M., Rouyet, L., Wendt, L., Hindberg, L., Stødle, D., Lauknes, T. R., Aslan, G., Hauglin, E., Dehls, J., Sundal, A., and Moldestad, D. A.: InSAR Svalbard Ground Motion Service: Product Description and User Manual, Geological Survey of Norway, NORCE Research AS and Norwegian Space Agency, https://svalbard.insar.no/docs/User-manual-InSAR-Svalbard.pdf (last access: 22 September 2026), 2026b.
Duchossois, G., Strobl, P., Toumazou, V., Antunes, S., Bartsch, A., Diehl, T., Dinessen, F., Eriksson, P., Garric, G., Holmund, K., Houssais, M.-N., Jindrova, M., Kern, M., Muñoz-Sabater, J., Nagler, T., Nordbeck, O., and de Witte, E.: User Requirements for a Copernicus Polar Mission – Phase 2 Report, EUR 29144 EN, Publications Office of the European Union, Luxembourg, ISBN 978-92-79-80960-6, JRC111068, https://doi.org/10.2760/44170, 2018.
Duchossois, G., Berdahl, M., Diehl, T., Garric, G., Humbert, A., Itkin, P., Jawak, S., and Tietsche, S.: Copernicus Polar Roadmap for Service Evolution, Publications Office of the European Union, Luxembourg, https://doi.org/10.2889/644108, 2024.
Hanssen-Bauer, I., Førland, E. J., Hisdal, H., Mayer, S., Sandø, A. B., and Sorteberg, A.: Climate in Svalbard 2100 – a knowledge base for climate adaptation, Chap. 7, Permafrost, avalanches and landslides, NCCS report no. 1/2019, Norwegian Centre for Climate Services, https://hdl.handle.net/10037/18819 (last access: 22 September 2026), 2019.
Humlum, O., Instanes, A., and Sollid, J. L.: Permafrost in Svalbard: a review of research history, climatic background and engineering challenges, Polar Res., 22, 191–215, https://doi.org/10.1111/j.1751-8369.2003.tb00107.x, 2003.
Liu, L., Schaefer, K. M., Chen, A. C., Gusmeroli, A., Zebker, H. A., and Zhang, T.: Remote sensing measurements of thermokarst subsidence using InSAR, J. Geophys. Res.-Earth Surf., 120, 1935–1948, https://doi.org/10.1002/2015JF003599, 2015.
Nicu, I. C., Rouyet, L., Rubensdotter, L., Sinitsyn, A., Wendt, L., Christiansen, H. H., and Loktu, L.: Permafrost-related hazard, vulnerability and risk estimates for cultural heritage and modern buildings in Svalbard, Zenodo [data set], https://doi.org/10.5281/zenodo.18154592, 2026.
NPI: NP Ortofoto Svalbard WMTS, Basemap service – Svalbard Orthophoto, Norwegian Polar Institute (NPI), https://geodata.npolar.no/ (last access: 22 September 2026), 2026.
Obu, J., Westermann, S., Bartsch, A., Berdnikov, N., Christiansen, H. H., Dashtseren, A., Delaloye, R., Elberling, B., Etzelmüller, B., Kholodov, A., Khomutov, A., Kääb, A., Leibman, M. O., Lewkowicz, A. G., Panda, S. K., Romanovsky, V., Way, R. G., Westergaard-Nielsen, A., Wu, T., Yamkhin, J., and Zou, D.: Northern Hemisphere permafrost map based on TTOP modelling for 2000–2016 at 1 km2 scale, Earth-Sci. Rev., 193, 299–316, https://doi.org/10.1016/j.earscirev.2019.04.023, 2019.
Rouyet, L., Lauknes, T. R., Christiansen, H. H., Strand, S. M., and Larsen, Y.: Seasonal dynamics of a permafrost landscape, Adventdalen, Svalbard, investigated by InSAR, Remote Sens. Environ., 231, 111236, https://doi.org/10.1016/j.rse.2019.111236, 2019.
Rouyet, L., Bredal, M., Lauknes, T.R., Dehls, J., Larsen, Y., van Oostveen, J., Hindberg, H., and Wendt, L.: InSAR Svalbard – User requirement, technical considerations, and product development plan, Report 2-2024-NORCE-Energy and Technology, NORCE Research AS, ISBN 978-82-8408-341-4, https://hdl.handle.net/11250/3125660 (last access: 22 September 2026), 2024.
Samsonov, S. V., Lantz, T. C., Kokelj, S. V., and Zhang, Y.: Growth of a young pingo in the Canadian Arctic observed by RADARSAT-2 interferometric satellite radar, The Cryosphere, 10, 799–810, https://doi.org/10.5194/tc-10-799-2016, 2016.
Scheer, J., Caduff, R., How, P., Marcer, M., Strozzi, T., Bartsch, A., and Ingeman-Nielsen, T.: Thaw-season InSAR surface displacements and frost susceptibility mapping to support community-scale planning in Ilulissat, West Greenland. Remote Sens., 15, 3310, https://doi.org/10.3390/rs15133310, 2023.
Strand, S. M. and Christiansen, H. H.: Permafrost thermal regime and active layer dynamics across periglacial landforms in Svalbard's Nordenskiöld Land Permafrost Observatory, 2008–2023, Arctic Sci., 11, 1–19, https://doi.org/10.1139/as-2024-0027, 2025.
Streletskiy, D. A., Maslakov, A., Grosse, G., Shiklomanov, N. I., Farquharson, L., Zwieback, S., Iwahana, G., Bartsch, A., Liu, L., Strozzi, T., Lee, H., and Debolskiy, M. V.: Thawing permafrost is subsiding in the Northern Hemisphere – review and perspectives, Environ. Res. Lett., 20, 013006, https://doi.org/10.1088/1748-9326/ada2ff, 2025.
Wendt, L., Rouyet, L., Christiansen, H. H., Lauknes, T. R., and Westermann, S.: InSAR sensitivity to active layer ground ice content in Adventdalen, Svalbard, The Cryosphere, 20, 1179–1197, https://doi.org/10.5194/tc-20-1179-2026, 2026.
Zwieback, S. and Meyer, F. J.: Top-of-permafrost ground ice indicated by remotely sensed late-season subsidence, The Cryosphere, 15, 2041–2055, https://doi.org/10.5194/tc-15-2041-2021, 2021.
Zwieback, S., Liu, L., Rouyet, L., Short, N., and Strozzi, T.: Advances in InSAR analysis of permafrost terrain, Permafr. Periglac. Process., 35, 544–556, https://doi.org/10.1002/ppp.2248, 2024.