
the Creative Commons Attribution 4.0 License.
the Creative Commons Attribution 4.0 License.
 | 07 Sep 2026
Connecting earth observation anomalies to farmer surveys for monitoring impacts of agricultural drought on rainfed rice yields in Nigeria
Nick Gutkin
Chiamaka I. Ehiemere

Koen De Vos
Nnamdi Ehiemere
Jeroen Degerickx
Sarah Gebruers
Uchechukwu Nwafor
Anne Gobin
Agricultural drought threatens rainfed rice production in Nigeria, where smallholder farmers depend on rainfall and have limited capacity to buffer climate shocks. While meteorological drought indices such as the SPI and the SPEI are widely used in national early warning systems, their ability to capture the impacts of droughts on rainfed rice yields at the smallholder field-level remains uncertain. This study evaluates the added value of earth observation (EO)-derived vegetation and soil moisture anomalies for monitoring and predicting drought impacts on rainfed rice yields in Nigeria. Satellite-based Normalized Difference Vegetation Index anomalies (NDVIA) and Soil Water Index anomalies (SWIA) were derived using a zonal clustering and thresholding approach and combined with farmer survey and yield data collected from 146 rainfed rice farmers across four major rice-growing states between 2019 and 2024. Multivariate regression models were used to assess the relationships between EO indicator anomalies and annual yield changes, and the effects of different zonal clustering and anomaly thresholds on anomaly calculation were evaluated. Results show that SPI and SPEI explain a substantial share of yield variability in some years, particularly when droughts coincide with sensitive phenological stages. However, EO-based anomaly indicators, especially SWIA (maximum improved R2 = 0.25), provide complementary information and significantly improve yield predictions in years when meteorological indices alone perform poorly. The timing of anomalies relative to rice phenology was critical, with droughts during panicle initiation having the largest yield impacts. Integrating EO-based vegetation and soil moisture anomaly indicators with existing meteorological indices can contribute to the monitoring of agricultural droughts and improve the operational relevance of early warning systems for rainfed rice farmers in Nigeria.
- Article
(10908 KB) - Full-text XML
- BibTeX
- EndNote


Droughts have serious impacts on farmers worldwide, resulting in yield losses that threaten farmer incomes and food security for local and global populations (Masih et al., 2014). Meteorological droughts are characterized by a water deficit caused by an imbalance between precipitation and evaporation. The resulting decrease in soil moisture reduces water availability for plants, causing agricultural droughts that damage crops and negatively affect yields and farmer incomes, especially for smallholder farmers without the means or infrastructure for irrigation (Liu et al., 2016). A large proportion of the population in Nigeria relies on subsistence farming (Onyeneke, 2021) and is vulnerable to the impacts of changing climate conditions on rainfall patterns. Rainfall patterns in Nigeria are projected to change drastically, with increasing drought intensity despite increasing rainfall, driven in large part by greater variability during the rainy season, which brings more extreme conditions (Ogunrinde et al., 2019, 2021). Climate modelling has shown an increasing frequency and duration of droughts in Nigeria, threatening the availability of water resources for agricultural use (Ogunrinde et al., 2022).
Rice is a staple crop in Nigeria, with consumer demand growing rapidly as domestic consumption patterns change. On the production side, rice has become a leading cereal crop in terms of value for farmers and is central to food security policy in the country (Gyimah-Brempong et al., 2016). Rainfed rice systems are crucial for rice production in Nigeria, with rainfed lowland ecologies accounting for 47 % of total production area, and rainfed upland ecologies representing over 30 % of rice production by land area (over 560 000 ha) (Alagbo et al., 2022). Despite large areas of rice production, Nigerian rice production accounts for 50 %–60 % of rice consumed in the country, with the remaining deficit made up by foreign rice imports (FAO in Nigeria, 2026; Onafeso et al., 2016; Udemezue, 2018). Rice production in Nigeria is dominated by smallholder farmers (approximately 90 %) (Chiaka et al., 2022), who cultivate small plots of land ranging from 0.2 to 3 ha. Rice farmers in the country remain vulnerable to extreme weather events (such as droughts), which can result in lower yields, stunted rice crops, and poor economic outcomes for farmers (Ajetomobi et al., 2011; Mbah et al., 2016; Nwalieji and Uzuegbunam, 2012; Ojo et al., 2022). Methods to monitor and predict drought impacts on rice yields are important at both the policy and farmer level to ensure food security and safeguard local rice supply against climate change.
Historically, several droughts have occurred in Nigeria, especially in the arid Northern states that include the Lake Chad region. Past drought events that significantly affected the population include the severe droughts of 1971–1973, 1983–1984, and 1991–1995 (Federal Ministry of Environment, 2018), which led to widespread crop failures, livestock deaths, depleted groundwater levels, and famine. These effects on agricultural production prompted the Federal Government of Nigeria to establish institutional frameworks and programs to minimize drought-related vulnerabilities. The Nigerian Meteorological Agency (NiMet) is responsible for analysing meteorological data, incorporating both satellite and weather station data, and delivering advice to farmers based on seasonal predictions, particularly for seasonal rainfall prediction and crop performance (Ofuoku and Obıazı, 2021). Nonetheless, current techniques are limited (Oloyede et al., 2023) and mainly rely on observations from sparse ground weather stations and long-term climate modelling (Akinyemi et al., 2020; Nigerian Meteorological Agency, 2025). AGRHYMET, a regional institution that monitors droughts in West Africa, regularly provides weather bulletins, crop monitoring analyses based on simulation models, and vegetation indices covering West Africa (including Nigeria) that track the growth and condition of vegetation (Traore et al., 2014). Earlier research has modelled and forecast rainfall patterns across West Africa, including Nigeria, incorporating both regional and global climate models (Olaniyan et al., 2022; Onyejuruwa et al., 2025). Long-term and seasonal predictions support farmers in seasonal planning; however, acute weather phenomena such as droughts and dry spells are difficult to predict, and farmers need early warning systems (EWS) to respond to such events. This is particularly relevant in West Africa, where rainfed agriculture is crucial for food security and is increasingly threatened by inconsistent rainfall patterns, droughts during crucial crop growth stages, and changes in the frequency and intensity of dry spells during the rainy season (Tefera et al., 2024). While many Earth Observation (EO)-based EWS exist for drought and vegetation condition at the global scale (Gommes et al., 2017; Rojas, 2021; Van Hoolst et al., 2016), they are often aimed at informing policy rather than providing farmers with clear warnings and guidelines during the growing season – even when tailored to the national scale (van Ginkel and Biradar, 2021; Vos et al., 2023). It is also unclear to what extent existing EWS are accessible to farmers or whether they are effective at predicting the impacts of drought events on farmers' harvest yields and income.
Currently, techniques used by NiMet to provide early warnings for farmers incorporate EO to monitor meteorological droughts. Meteorological drought indices are a common approach to understanding characteristics such as drought severity and are often linked to insurance schemes for smallholder farmers. The Standardized Precipitation Index (SPI) is one such index and has been used to model precipitation deficits in Nigeria, however researchers note that drought management responses remain reactive rather than proactive (Okpara et al., 2017) – a challenge for all systems that rely on monitoring alone. SPI is currently the primary drought index used by NiMet in quarterly bulletins analysing meteorological trends across Nigeria (Nigerian Meteorological Agency, 2025). SPI is also highlighted by the World Meteorological Organization as a useful indicator for drought monitoring (WMO and GWP, 2016). While the SPI is based only on precipitation data, the Standardized Precipitation and Evapotranspiration Index (SPEI) considers water balance deficit through also incorporating evapotranspiration from plants and soils. SPEI has been used in the past to assess climatic impact on rice yields in the Gambia, demonstrating that increasing temperatures and lower precipitations are correlated with significant decreases in rice yields (Jabbi et al., 2021). Notably, SPI and SPEI correspond well in humid regions, however in semi-arid and arid regions the signals diverge, with SPEI detecting droughts more frequently and earlier than SPI (Mwinjuma et al., 2026). This is particularly relevant when studying agricultural trends in countries such as Nigeria, which contain gradients of aridity along which the same crop (in this case rice) is grown. However, these indices ultimately detect meteorological droughts, which depend on precipitation and evaporation patterns, while agricultural droughts link the impacts of meteorological droughts to adverse impacts on crop productivity due to a deficit in root zone soil moisture (De Vos et al., 2025; Hazaymeh et al., 2016). The impacts of meteorological droughts on crops can also be varied, especially in complex and heterogeneous environments found in African agricultural landscapes (Guo et al., 2023).
Assessing the impact of agricultural droughts involves monitoring the evolution of crop conditions over time in response to meteorological droughts. However, the vegetation response to drought conditions is not always easy to predict from EO data, and may follow complex, localized patterns depending on the type of vegetation and the region (Henchiri et al., 2020). EO can be used to monitor vegetation dynamics using satellite-derived vegetation indices. The Normalized Difference Vegetation Index (NDVI) is a common vegetation index calculated from the red and near-infrared bands of multispectral satellite images, and NDVI anomalies (NDVIA) can be used to assess the degree of plant stress due to a variety of factors, including drought. NDVI has been employed in the past to develop an open-source EWS for drought monitoring in Nigeria (Adedeji et al., 2020). One advantage of NDVI as a drought indicator is the long historical timeseries available from past and present EO missions, allowing for long-term statistical analysis and robust anomaly calculation. Indices based on the analysis of NDVIA over a historical time period, or during an individual growing season, have been implemented as indicators of vegetation condition and to assess drought risks across large regions (Kogan, 1990, 1995; Traore et al., 2014). Changes in NDVI or NDVIA during multiple stages of rice development are associated with impacts on grain yield (Ali et al., 2014; Phyu et al., 2020). However, it remains unclear how changes in vegetation indices translate into actionable information for farmers about potential drought impacts on their rice crops in rainfed rice systems. This is particularly the case for NDVIA-based indicators, which inherently involve methodological choices when defining an anomaly threshold relative to a spatiotemporal baseline.
While NDVI can be used to monitor vegetation conditions, soil moisture can also serve as an effective proxy for agricultural drought. The Soil Water Index (SWI) estimates the soil moisture profile from EO data and can be used for representing the root-zone soil moisture available at different depths (Bauer-Marshallinger, 2018; Paulik et al., 2014). A maximum depth of 60 cm has been used in the past to describe the rooting depth of common rainfed rice varieties grown in Africa (Kijoji et al., 2014). Soil moisture anomalies calculated from EO data have been used in past studies (sometimes in conjunction with NDVI) to identify drought events and monitor drought impacts on vegetation and agriculture (De Vos et al., 2025; Tian et al., 2022; Zribi et al., 2021). Due to the freshwater demands of rice crops, soil moisture is a key variable to monitor for understanding the yield impacts of anomalies in soil water content (Zampieri et al., 2018). Soil moisture time series have been linked to rice yields from national-scale farmer surveys in Madagascar (Rigden et al., 2022), however a link with localised surveys with smallholder farmers is missing. In particular, an operational gap exists between the EO indicator-based monitoring of droughts and how they affect rainfed rice yields for smallholder farmers most affected by such droughts. Our research aims to bridge this gap by contributing to a better understanding of how EO indicator-based drought analysis can be tailored to increase relevance for smallholder farmers and ultimately improve the operational effectiveness of EWS systems employed by NiMet.
The objective of this research is, therefore, to assess the added value of EO indicator anomalies for predicting the impacts of agricultural droughts on rice yields in Nigeria in addition to the indicators already monitored by NiMet. We use a statistical approach to calculate pixel-level anomaly values from existing EO indicators to monitor vegetation condition and soil moisture (Adefisan and Abatan, 2015). Furthermore, we assess the impacts of key parameters in calibrating EO anomaly indicators, namely the selection of the optimal number of agricultural zones and the upper threshold for identifying negative drought impacts. Finally, we compare this approach with one based solely on meteorological indices to assess whether EO anomaly indicators improve monitoring of drought impacts on rainfed rice production. We validate EO anomaly indicator-based drought predictions using farmer survey data, a comprehensive analysis of zonal calibration and threshold sensitivity for calculating EO indicator anomalies, and a comparison of EO-anomaly indicators with traditional drought indices for predicting drought impacts on rice yields. We use the results of these analyses to understand the extent to which EO can be used as an input to improve EWS for predicting drought impacts on rainfed rice farmers in Nigeria, with the intention of informing policy and supporting the development of improved EWS systems for farmers in the region.
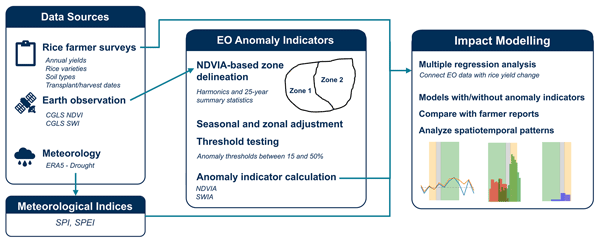
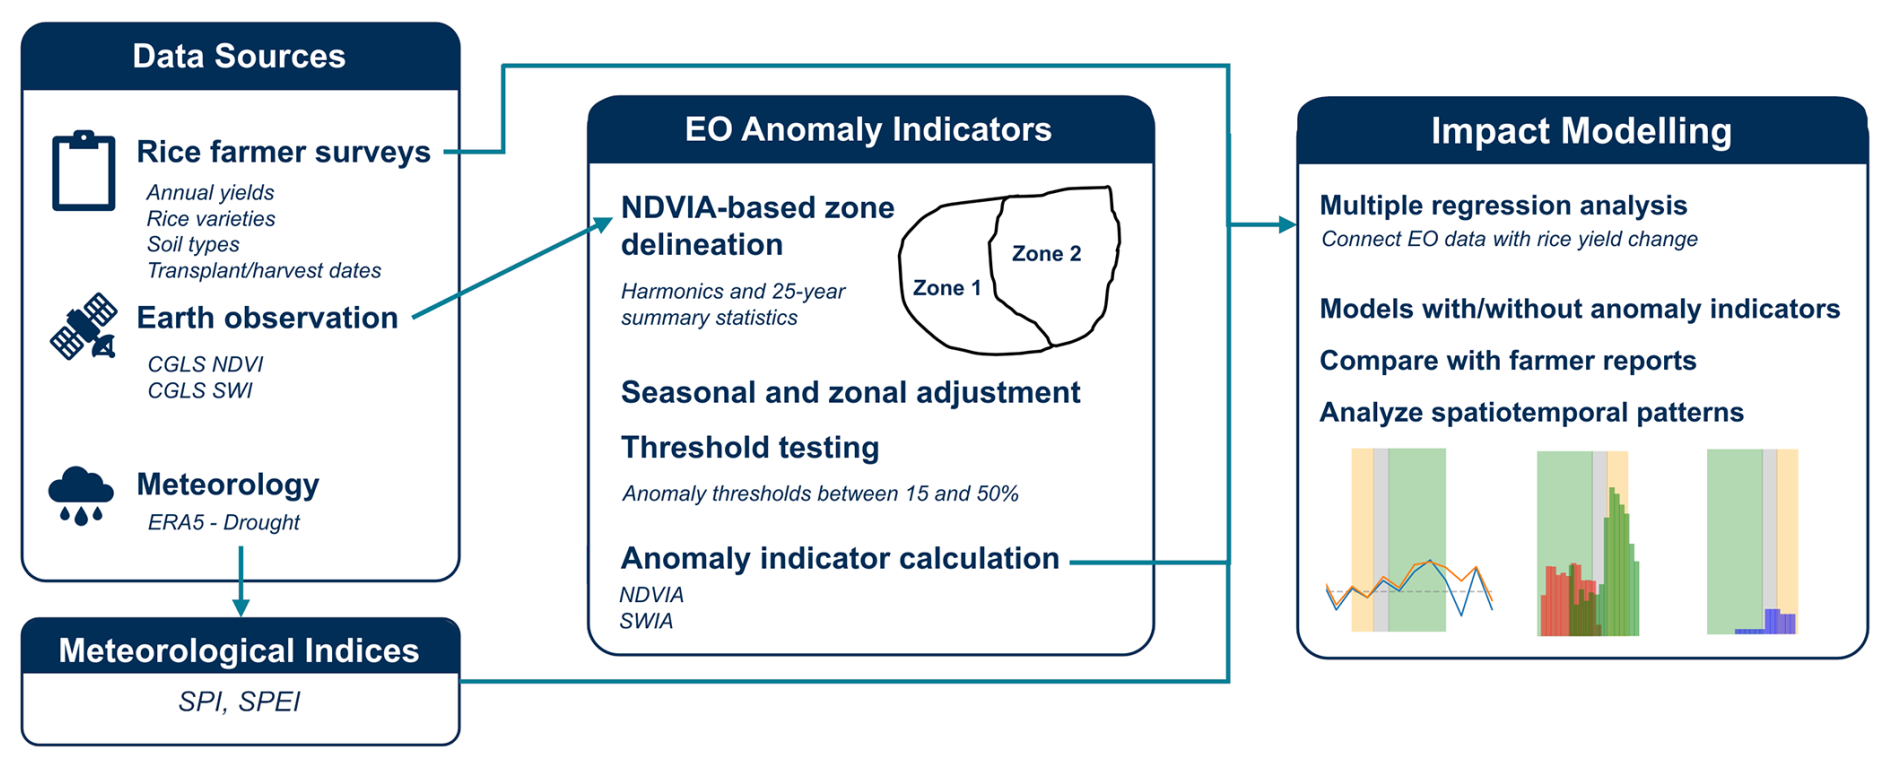
To evaluate how well traditional drought indices and the proposed NDVIA approach monitor drought impacts on Nigeria's rainfed rice systems, we combine satellite- and climate-derived indicators with plot-level survey, GPS, and yield data from major rice-growing states (Fig. 1). We then compare index signals with reported drought impacts and model rice yields using these inputs to assess early-warning potential and quantify drought–yield relationships.
2.1 Study area
With two main seasons (dry and wet), climate conditions are generally favourable for agriculture in Nigeria. The Tropical Continental airmass drives the dusty Harmattan winds from the Sahara Desert during the dry season, while the Tropical Maritime airmass from the Atlantic Ocean has a significant impact during the rainy season (Eludoyin et al., 2014). Total annual rainfall ranges from 1500 to 4000 mm in the South and 300 to 1000 mm in the North, with droughts occurring mostly at the start of the wet season due to the impenetrability of the moisture laden airmasses deep into the hinterlands (Federal Ministry of Environment, 2018).
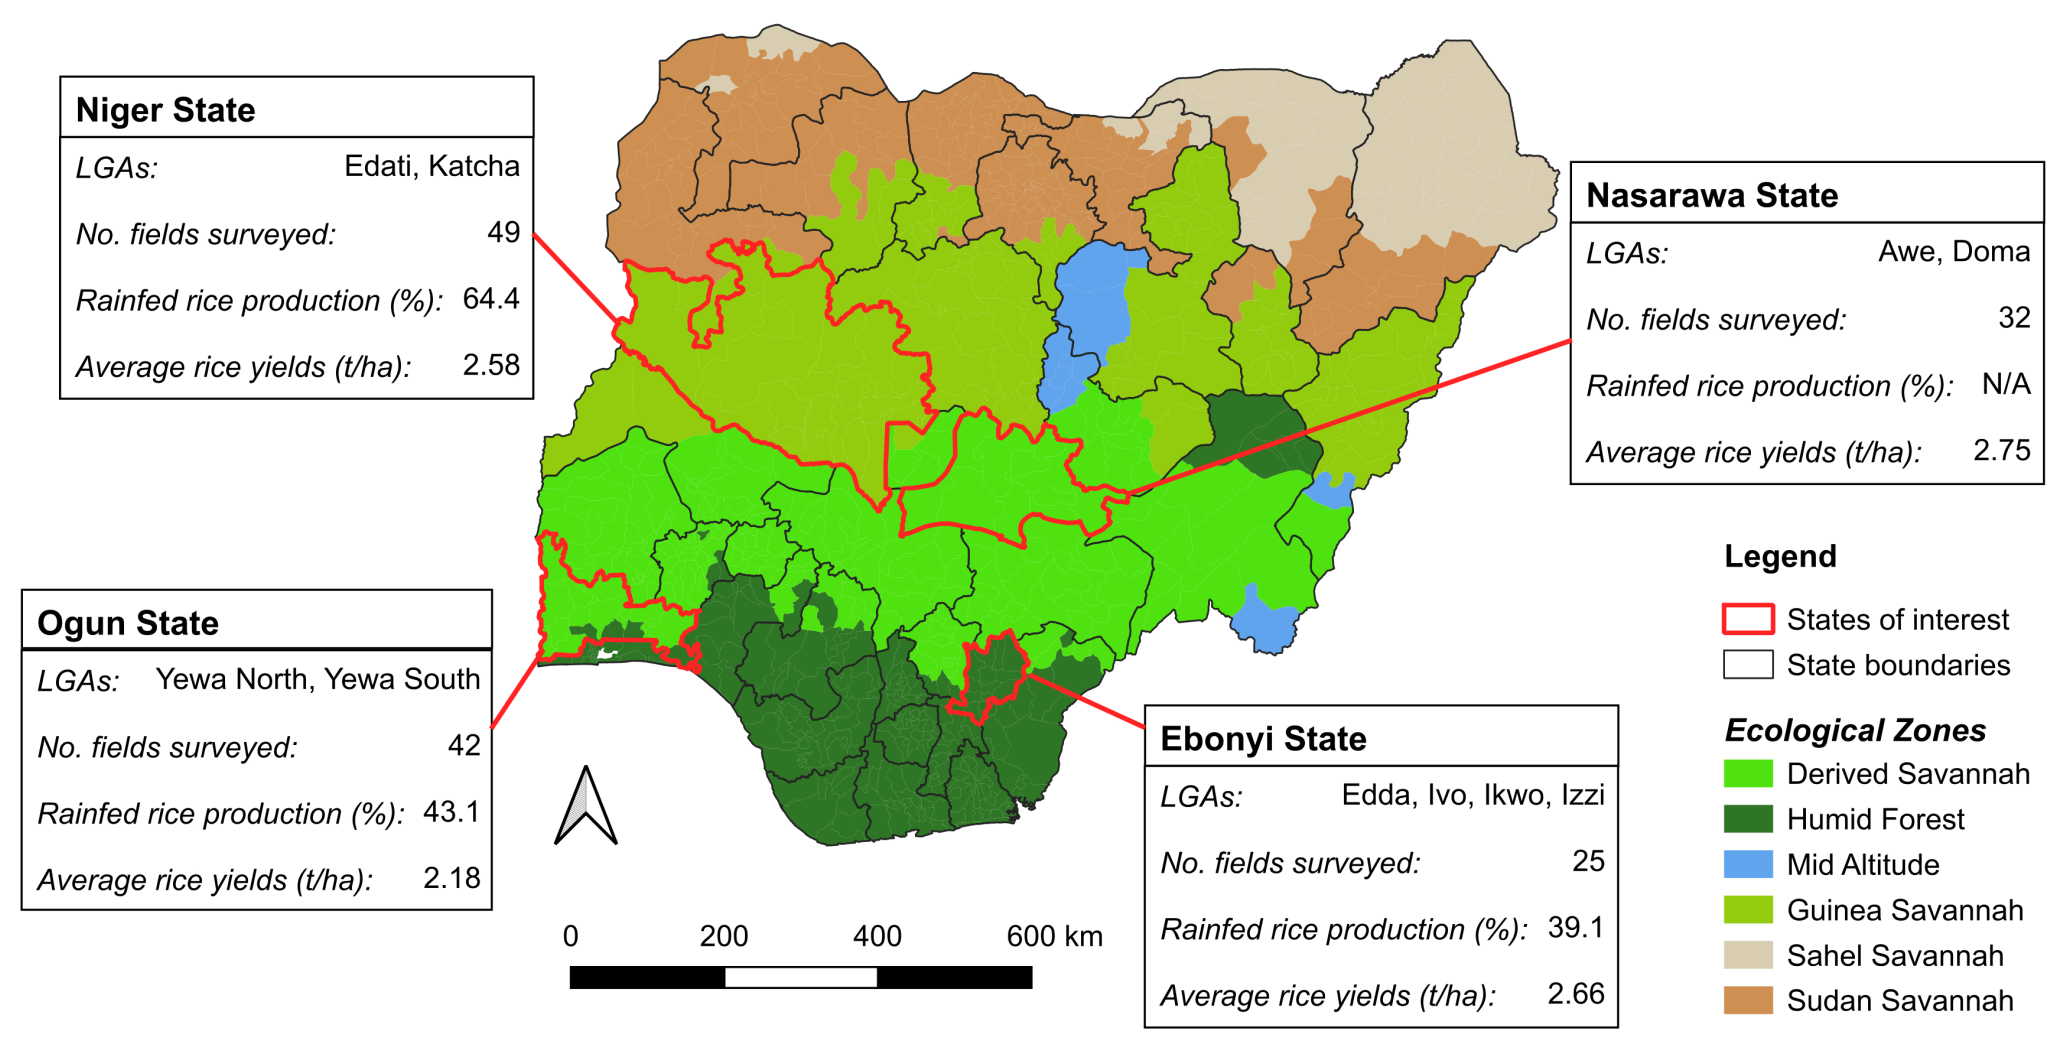
Figure 2Location within Nigeria of the states of interest and local government areas (LGAs) surveyed in this study. Rainfed rice production percentages obtained from (Mba et al., 2021; Omoare and Oyediran, 2020) and average rice yields obtained from (National Bureau of Statistics, 2019). Local ecological zones adapted from (Adenle et al., 2020; States in Nigeria by Ecological Zone, 2026; FORMECU, 1998). Additional details in Table A1.
Nigeria consists of a gradient of agroecological zones that run from south to north from the Atlantic coast to the arid Sahel plains (Fig. 2) (Adenle et al., 2020; FORMECU, 1998). The humid tropical forest zone of the South, with its bimodal rainfall pattern and rich sandy loam-clay soils, supports rainfed rice production, while the Sudan-Sahel zones of the arid North rely solely on intensive irrigation for rice cultivation due to the below-average rainfall and sandy soil with low water-holding capacity (Nigeria – Global yield gap atlas, 2026). Rainfed rice production in Nigeria is categorized into two major systems: rainfed upland and rainfed lowland (referred to as fadama in northern Nigeria – rice cultivation in low-lying valleys and floodplains). The upland system which accounts for 30 % to 35 % of the total rice cultivated area in Nigeria (Erenstein et al., 2003) is characterized by low fertility, well-drained soils that are entirely dependent on rainfall for moisture, leading to poor yields in the absence of secondary water sources. The lowland rice system, the dominant system in the study area, covers nearly 50 % of the total rice area (Erenstein et al., 2003). Yields in the lowland are substantially higher because the rice fields are constantly flooded or waterlogged during the rains, with water supplied from multiple sources, including direct rainfall.
The rice calendar of Nigeria is complex and varies across the different rice production systems. Generally, in the South, land preparations commence in March to April with the first rains, with sowing or transplanting occurring between April and June, and subsequent harvest from September-October, depending on variety. With a shorter wet season, land preparations in the North occur between May and June, with sowing in June and July, followed by harvests between October and November.
Fieldwork was conducted in March and April 2025 with the purpose of administering surveys to rainfed rice farmers in the target states, as well as collecting GPS coordinates of their rice plots. In total, 10 local government areas across four states were visited, where farmers from rainfed rice-farming communities responded to predefined survey questions through face-to-face interviews. After reviewing the surveys for completion and accuracy, farmers went with trained enumerators to identify their rice plots and collect GPS coordinates. In total, surveys were administered to 226 rainfed rice farmers, with 154 rice plots identified by GPS location. Information collected in the surveys included data on predominant soil type, rice varieties, timing of transplanting and harvesting, and the yield impacts of past droughts experienced over the years 2019–2024. Yield data were collected according to farmers' recollections of annual harvests, converted to metric tonnes, and tonnes per hectare were calculated per farmer plot using GPS-delineated polygons. The field data were used to assess and validate the drought analysis approaches implemented in this study.
2.2 Satellite data
Following the approach of De Vos et al. (2025) NDVI time series were extracted using openEO from two harmonized Copernicus Land Monitoring Service products for Nigeria. The CGLS NDVI v3 product, generated from SPOT/VEGETATION and PROBA-V sensors at a 1 km spatial resolution (Smets et al., 2020), was obtained in 10 d intervals (dekads) covering dates from 1999 until 2020, and from 2020 until 2024 the CGLS NDVI v2 was obtained at 300 m spatial resolution (Swinnen et al., 2022), generated from the Sentinel-3 OLCI sensor was used with the same time intervals and resampled to 1 km spatial resolution using nearest neighbour resampling in openEO in order to match the spatial resolution of the v3 product. Invalid pixels (e.g., due to cloud coverage) were filtered out. SWI data was available through the CGLS SWI v4 product, generated from the H29 Metop ASCAT 12.5 km SSM Near Real Time product, available at a 12.5 km spatial resolution at 10 d intervals (Raml and Bauer-Marshallinger, 2025). The lower resolution data was upscaled using bilinear interpolation to match the 1 km resolution of the NDVI products.
Next, in addition to per-pixel descriptive statistics (long-term average, standard deviation, 10th, 50th, and 90th percentiles), a harmonic analysis was conducted to model the multiannual dynamics of seasonal vegetation changes. This harmonic analysis was conducted because vegetation dynamics can exhibit periodicity that varies with vegetation type, agroecological zoning, and management practices. By using sinusoidal waves to describe those patterns, parameters such as the amplitude and phase of the sinusoidal waves can be used to differentiate between different crop types or systems (Jung and Chang, 2015). A least-squares approach was used to find the coefficients of sine and cosine harmonic waves for the first three harmonics (Eq. 1) to represent the maximum number of potential growing seasons in the study area (with two potential rice seasons and an additional fallow/vegetable season) and to align the wavelength with the duration of a rice growing season (approximately 100 d). Pixel-level sine/cosine coefficients (af, bf), amplitude (Af) (Eq. 2), and phase (ϕf) (Eq. 3) were also used as inputs for the zonal clustering approach.
Due to the different agroecological zones in Nigeria and considering the differences in agricultural management practices, access to water, and crops grown across different communities, a spatial zoning approach was used to identify drought patterns as they occur within individual regions that share similar characteristics (Adefisan and Abatan, 2015; Page et al., 2017; Perera et al., 2022). To this end, zonal clustering based on the KMeans algorithm was chosen as an appropriate approach to separate pixels into separate zones based on the similarity of their NDVI values, harmonics, and location (latitude and longitude included as features). The number of zones used in clustering was tested to understand the impacts of zoning on anomaly indicator values. This approach has been used in the past, especially in the crop insurance industry, where zoning is important for accurately modelling climate risk based on agricultural production patterns and satellite-derived environmental data (Kirchner et al., 2025). The zone delineations calculated from historical NDVI data were also used to delineate zones for processing SWI data (Bauer-Marshallinger, 2018; Paulik et al., 2014) in the following steps. The SWI band “SWI_040” was used, representing a T latency factor of 40, which roughly represents the water present in soils up to a depth of 60 cm (Kijoji et al., 2014; Raml and Bauer-Marshallinger, 2025).
2.3 Zonal adjustment and anomaly calculations
Reflecting differences in environmental and management variables across agroecosystems in Nigeria, zonal dekadal statistics were calculated for both EO indicators (SWI and NDVI), summarising the two historical datasets per dekad and per pixel for all available years, including mean, standard deviation, and percentile values. The dekad pixel mean was adjusted by the respective zonal median to obtain an adjustment factor, which was then applied to the EO indicator data at the pixel scale to reduce outlier values in each zone. However, the total number of zones had a large impact on both the calculation of EO indicator anomaly values as well as the final results. Therefore, we tested a range of zones (5–120) in 10-zone increments to assess the impact of different zone distributions (and as a result, different zonal statistics) on yield model results (Fig. 3).
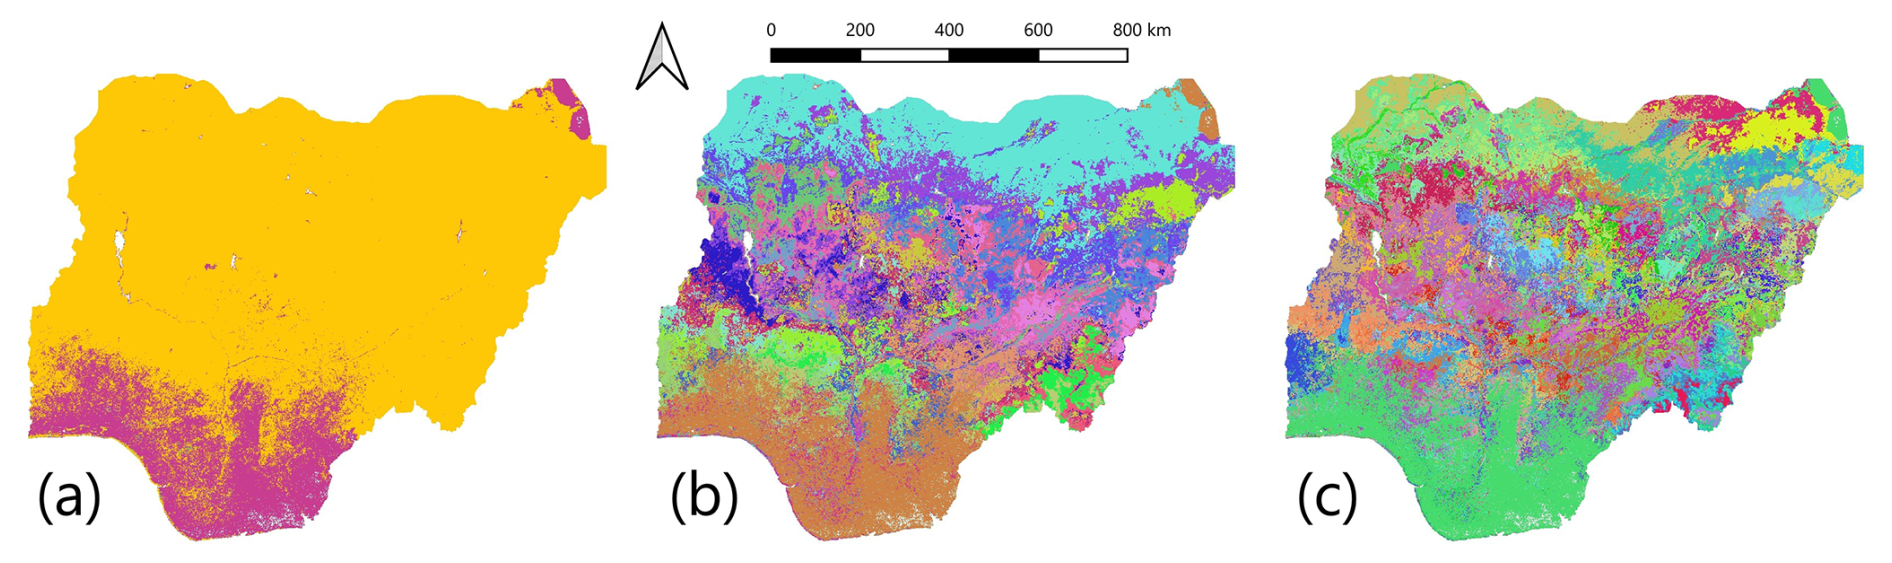
Figure 3Different spatial zones over study area showing increasing complexity of zone distribution with (a) 10 zones, (b) 60 zones, and (c) 120 zones. The pixel zone clusters were used to calculate zonal adjustment factors for both NDVI and SWI anomalies.
The dekadal anomaly calculation is similar to the Vegetation Condition Index (VCI) proposed by (Kogan, 1990), however rather than identifying minimum and maximum EO indicator values over the historical time period, we calculate pixel-level statistical thresholds at low historical EO indicator values. Equation (4) is used to normalize EO indicator values to upper and lower thresholds to values between 0 and 100. Zero values indicate no EO indicator anomalies, while non-zero values scale linearly to 100, which indicates an EO indicator anomaly below the lower threshold value.
Where for a single pixel, the EO indicator anomaly (EOIA) value for a dekad d is determined by a ratio of differences between the EO indicator value for that dekad (EOId) and the lower (5th percentile) and upper (e.g. zonal 15th percentile) threshold values (EOIlower, EOIupper). These threshold values were used by De Vos et al. (2025), however we also tested a range of EO indicator upper threshold values up to 50 % as higher upper threshold values by design will result in more pixels identified as drought, ultimately influencing model outcomes. This range of values was tested to identify the upper threshold value leading to the best yield model results, while the lower threshold was maintained at 5 %. Using the zone distributions generated from NDVI data, we applied Eq. (4) to calculate anomaly values for both SWI and NDVI.
2.4 Multivariate regression analysis
To understand how both traditional meteorological indices and EO indicator anomaly variables could be used to monitor drought impacts on farmers' rice yields, available meteorological and vegetation indices, together with field data, were used as input variables to fit multivariate regression models. Field data (soil type, rice variety) were converted from categorical to dummy variables for use as inputs. For input variables derived from meteorological indices and remote sensing data, summary statistics (median, minimum, maximum, standard deviation) were used to summarize dekad values for the entirety of the rice growing season. SPI/SPEI variables were first used to fit regression models with all aggregation time windows (1-, 3-, 6-, and 12-month periods), but models were also fit to the index of each time window to understand whether the preceding precipitation and evapotranspiration trends were important for predicting yield changes. This approach was also aimed at understanding whether different time windows might be more correlated to yield changes in different years due to different drought conditions and patterns. Additionally, for EO indicator anomaly variables, the number of dekads with non-zero anomaly values during the growing season was used as an input variable. Inputs were grouped by category to assess the additional benefits of each set of input variables in improving model accuracy (Table 1). Annual changes in rice yields were calculated per plot using the annual yields reported by farmers in the field surveys. Yield data were cleaned by removing null yields and yield change values outside the 5th/95th percentile range for each year to prevent outliers from affecting model accuracy.
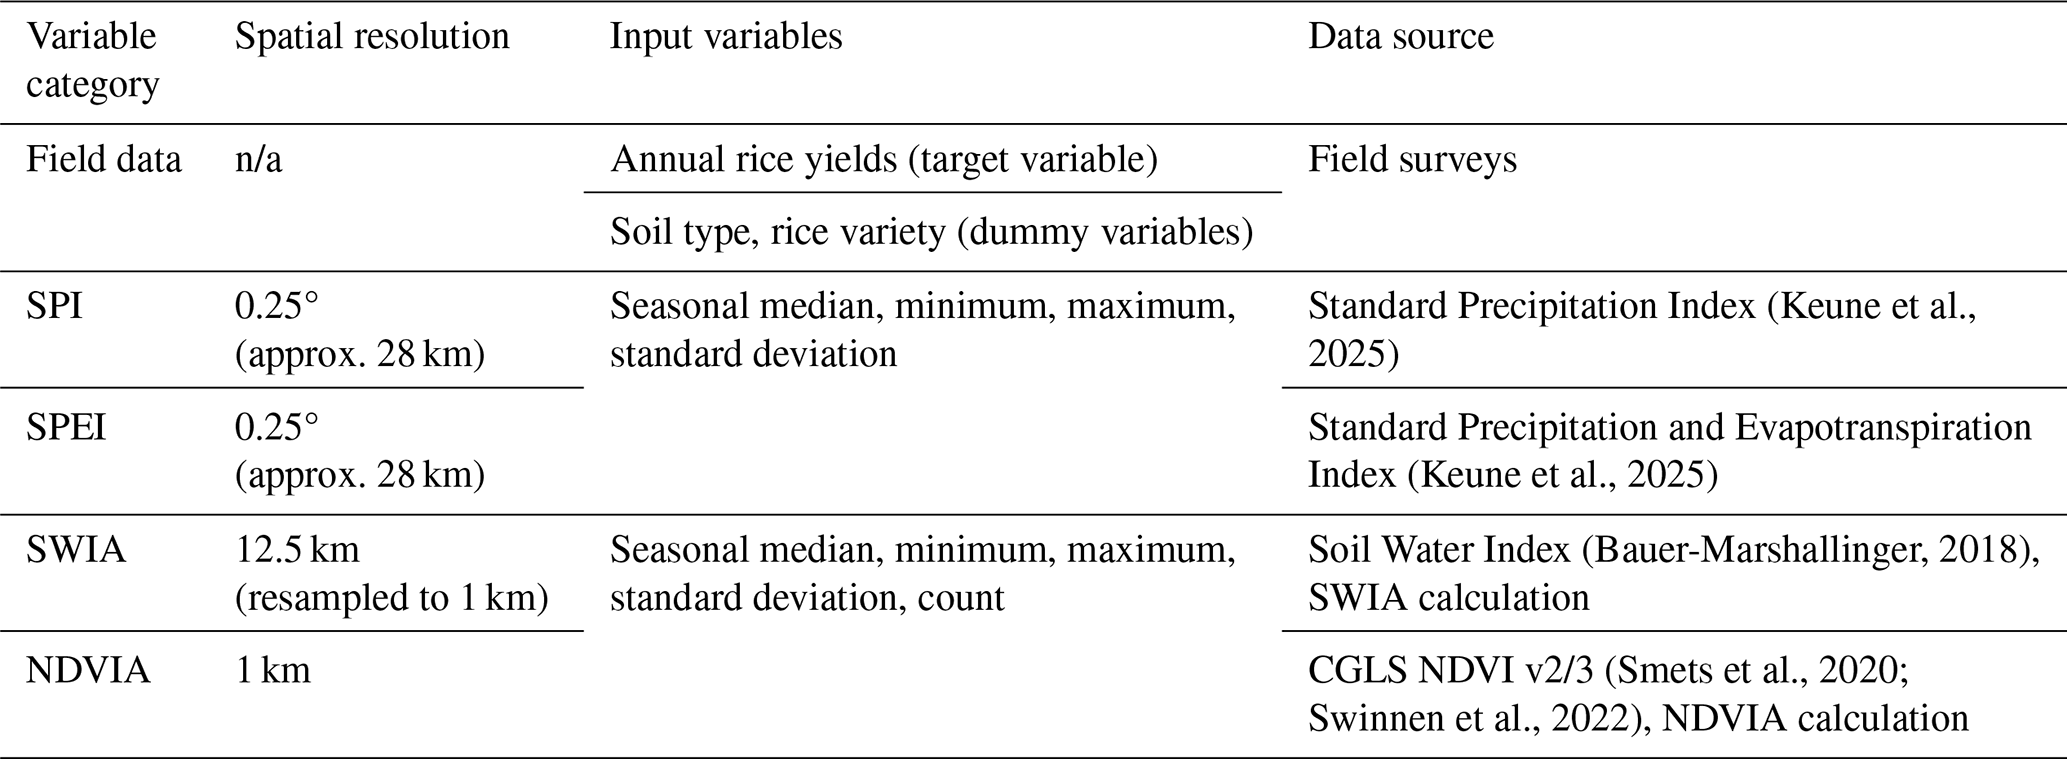
To assess whether NDVI/SWI patterns across distinct parts of the rice growth cycle were correlated with rice yield changes, we also calculated anomaly variable statistics over separate phenological stages, rather than over the entire growing period. Due to the short duration of the panicle initiation growth stage (approximately three dekads), the rice growing season was only divided into two phenological periods (vegetative and maturity), separated at the beginning of the panicle initiation period. Phenological summary statistics (median, minimum, maximum, standard deviation) summarized dekad values over each phenological period. These summary statistics were also used as model inputs and model results were compared with those obtained with NDVIA/SWIA summary statistics calculated over the entire growing season. Multivariate regression models were trained, and accuracy metrics (adjusted R2 score [adj-R2], RMSE, model p-value) were iteratively calculated for EO indicator anomaly values calculated in a range of 5 to 120 zones, and 15 % to 50 % upper threshold values. The other input variables remained the same across all regression models. Regression models were fit to yield data for 2020–2024, and model adj-R2 scores were used to evaluate impacts of zoning and upper threshold values on model results.
3.1 Field survey results
Droughts in rainfed rice plots were mostly reported by farmers at the height of the rice growing season, between June and September. From the 5 years surveyed, 2021 stands out as a year with less farmer-reported droughts throughout all growing season months. In contrast, there were many more droughts reported by farmers in 2024 than in all previous years – particularly in the months of July and August, there were more than double the number of plots with drought reported than in any of the previous years (Fig. 4). The increased number of farmers reporting drought impacts on their rainfed rice plots in 2024 underscores the importance of improving climate-resilient agricultural practices, scaling up local irrigation infrastructure, and expanding EWS and localized climate advisories to help farmers adapt in real time to changing climate conditions. Due to differences in transplant time and rice varieties used by farmers, varieties reach different stages of their development cycle at different times in the growing season. Though farmer responses were not divided on an annual basis, 62 % of the surveyed farmers had experienced drought stress during the panicle initiation stage of their rice crops, suggesting large negative impacts of drought on their final yields (Fig. 4). Cleaned rice yield changes generally followed normal distributions centred around no annual change (Fig. A1). However, 2020 and 2024 yield changes were skewed toward negative yield changes, indicating most farmers' yields reduced those years, while 2021 yield changes skewed positive, likely due to the yield losses the year before. 2024 also had the highest variability in yield changes, with some reported yield losses even below yield values that would be possible in rainfed rice fields. Yield change distribution was skewed slightly negative in 2022 as well, indicating a cluster of farmers that experienced yield losses, while 2023 yield changes were evenly distributed between yield losses and gains.
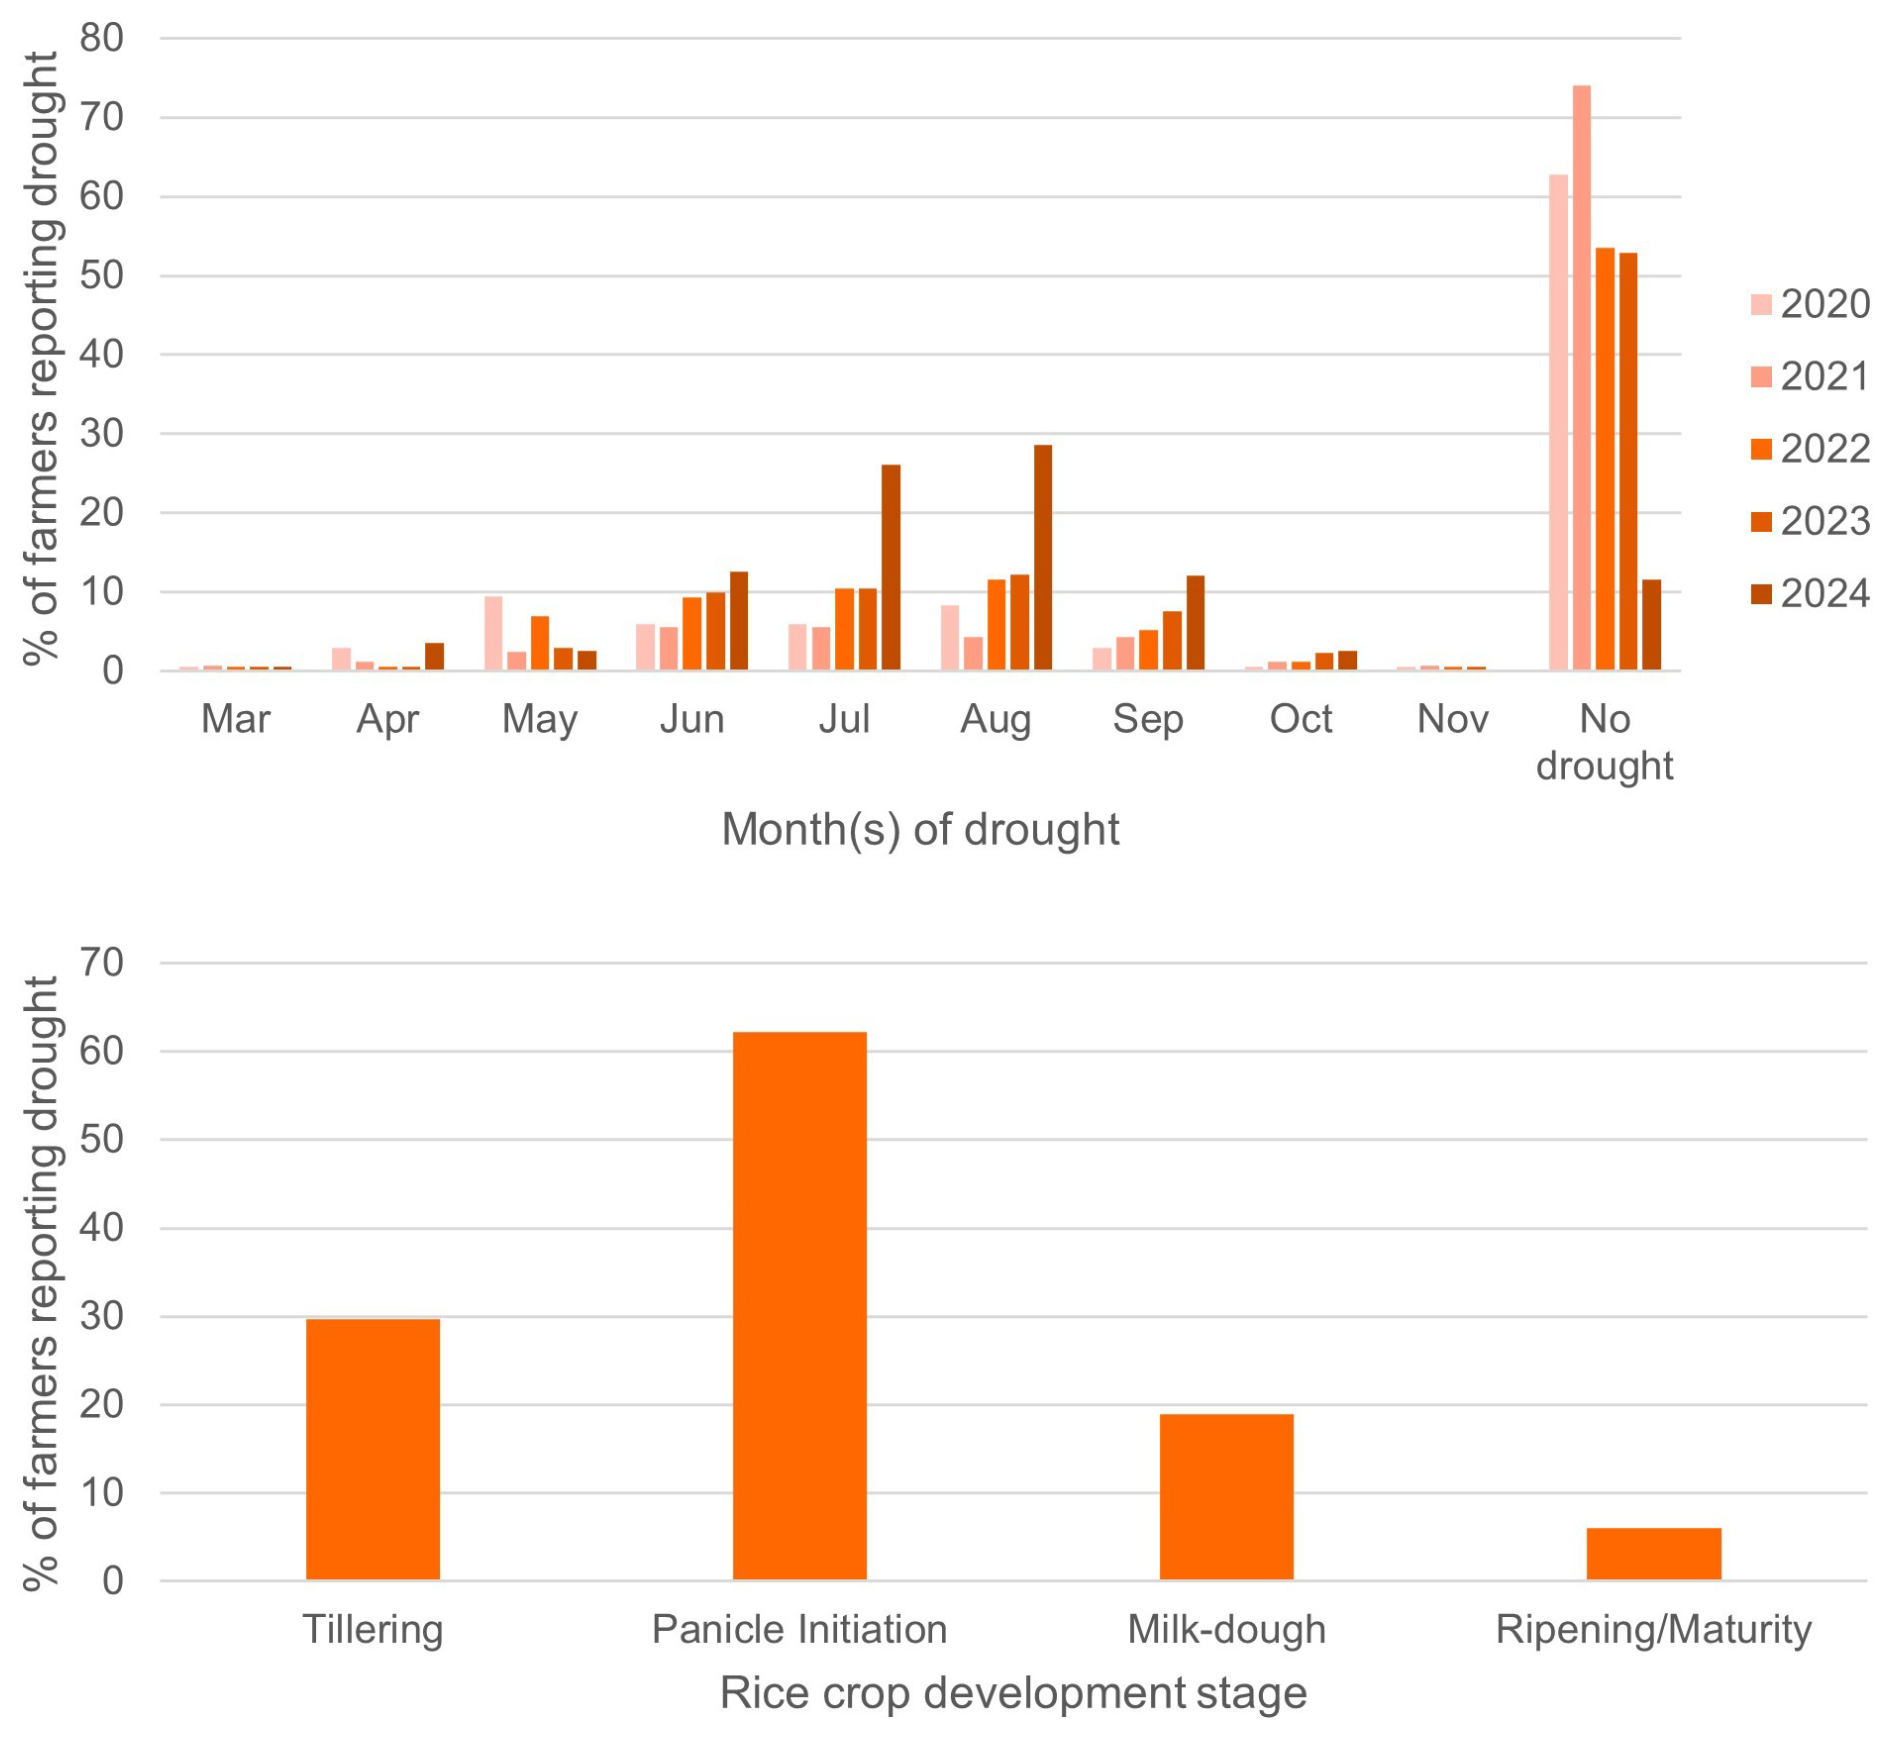
Figure 4Months with drought(s) reported by farmers during field surveys (top), and rice crop development stages during which farmers experienced drought stress on their crops (bottom).
3.2 Anomaly calculation parameters
The number of dekads with non-zero NDVIA and SWIA values during the entire rice growing season at each surveyed plot location increased with higher upper threshold values. This was expected, as an increased upper threshold decreases the sensitivity of anomaly calculations, thereby identifying a broader range of EO indicator values as anomalies. Notably, an increased number of zones decreased the total number of non-zero NDVIA values, while an increased number of zones led to slightly more non-zero SWIA values, particularly at larger upper threshold values (Fig. 5). Initial principal component analyses showed that NDVI statistical values were distributed in a gradient across the first two principal components, however a silhouette score analysis identified slight elbow patterns around the 20–30 zone and 50–60 zone marks (Fig. A2). Furthermore, there were differences in the number of non-zero NDVIA and SWIA values per year, with the lowest number of non-zero NDVIA and SWIA values in 2021 and 2023, respectively. Both indices identified 2020 as the year with the largest number of non-zero anomaly values. This does not necessarily align with farmers' self-reported annual drought impacts, which were lowest in 2021 and reached a peak in 2024. However, as we count all dekads during a growing season that had non-zero NDVIA/SWIA values, some of the counted drought dekads did occur during parts of the growing season that would have had limited impact on rice yields.
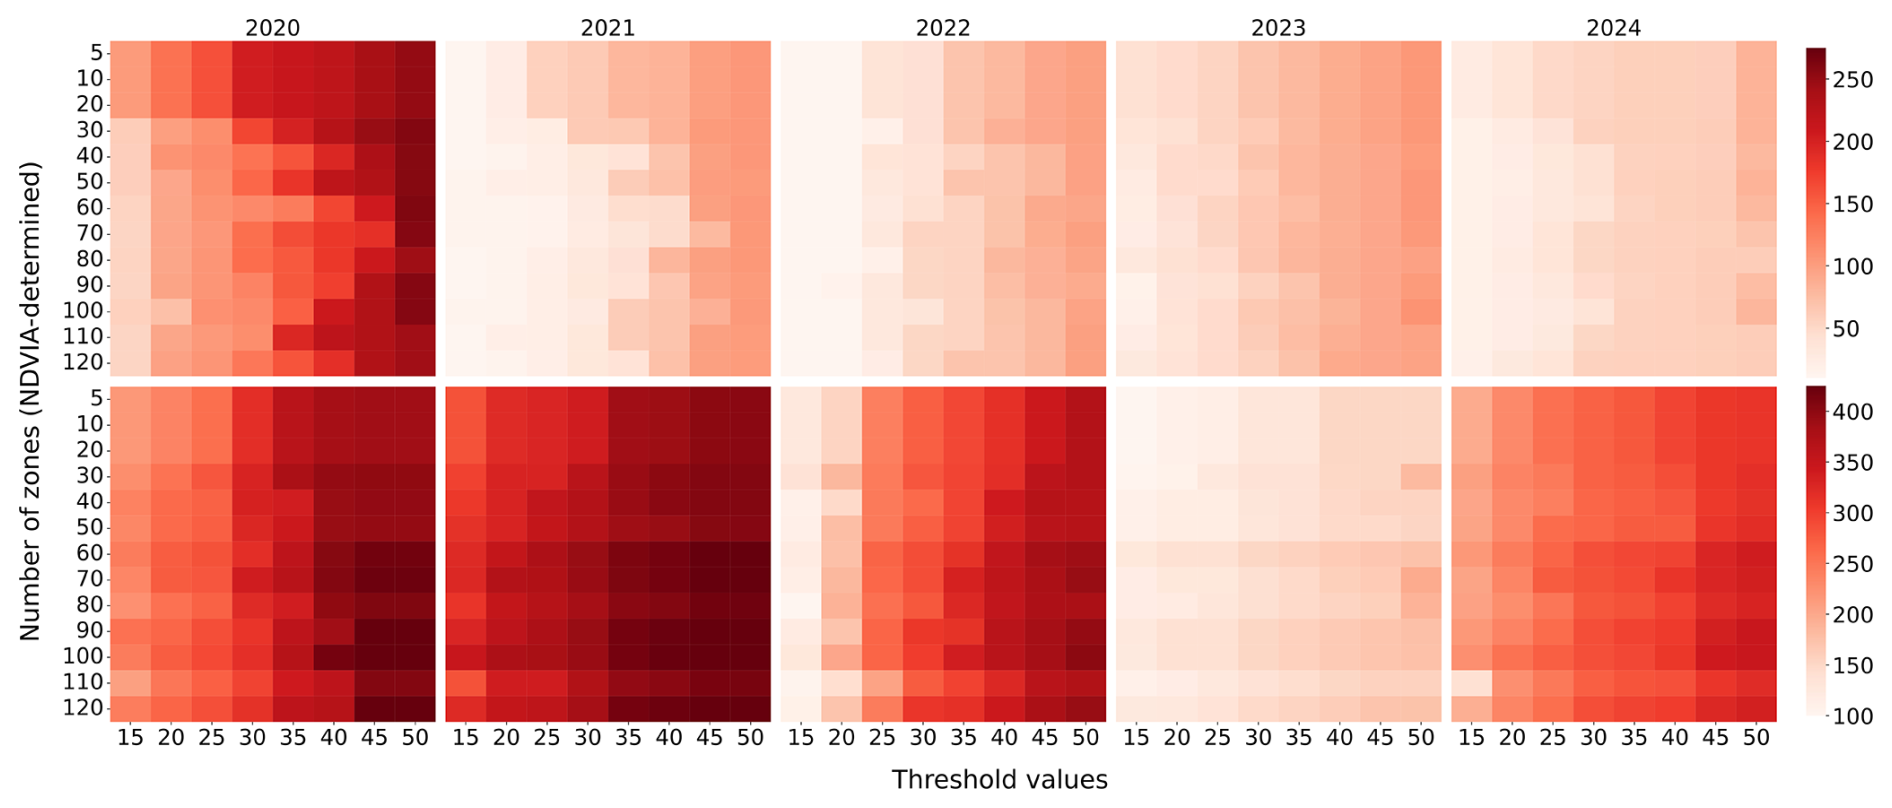
Figure 5Number of dekads with non-zero NDVIA (top) and SWIA (bottom) anomaly values for tested combinations of zones and upper threshold values.
Evaluating the spatial distribution of NDVIA with different combinations of zones and upper threshold values, clear patterns emerge as well during identified drought moments (Fig. 6). At a very low zone number, pixel values of the very arid north of Nigeria are included in summary statistics for some of the northern zones, which means that desert-like seasonal patterns influence the calculation of both vegetation seasonality and anomaly values. By mixing desert and vegetation pixels in the same zonal clusters, the algorithm reduces the specificity of the anomaly predictions, leading to higher and more generalised NDVIA values. In contrast, once zonal complexity is more accurately captured (such as above 40 zones in Fig. 6), there is not much difference in anomaly values with an increasing number of zones. Increasing upper threshold values increase the number of non-zero NDVIA values, and increase the NDVIA values themselves, regardless of the number of zones. For SWIA results, similar patterns emerge, with increasing upper threshold values increasing the extent of pixels with non-zero SWIA values. Increasing the zone number also identifies more areas with soil moisture anomalies, particularly in the more arid north of the country (Fig. A3). From the spatial distribution of anomaly pixels, there is a clear minimum of zones necessary for more accurate drought predictions, however an optimal number of zones is difficult to identify.
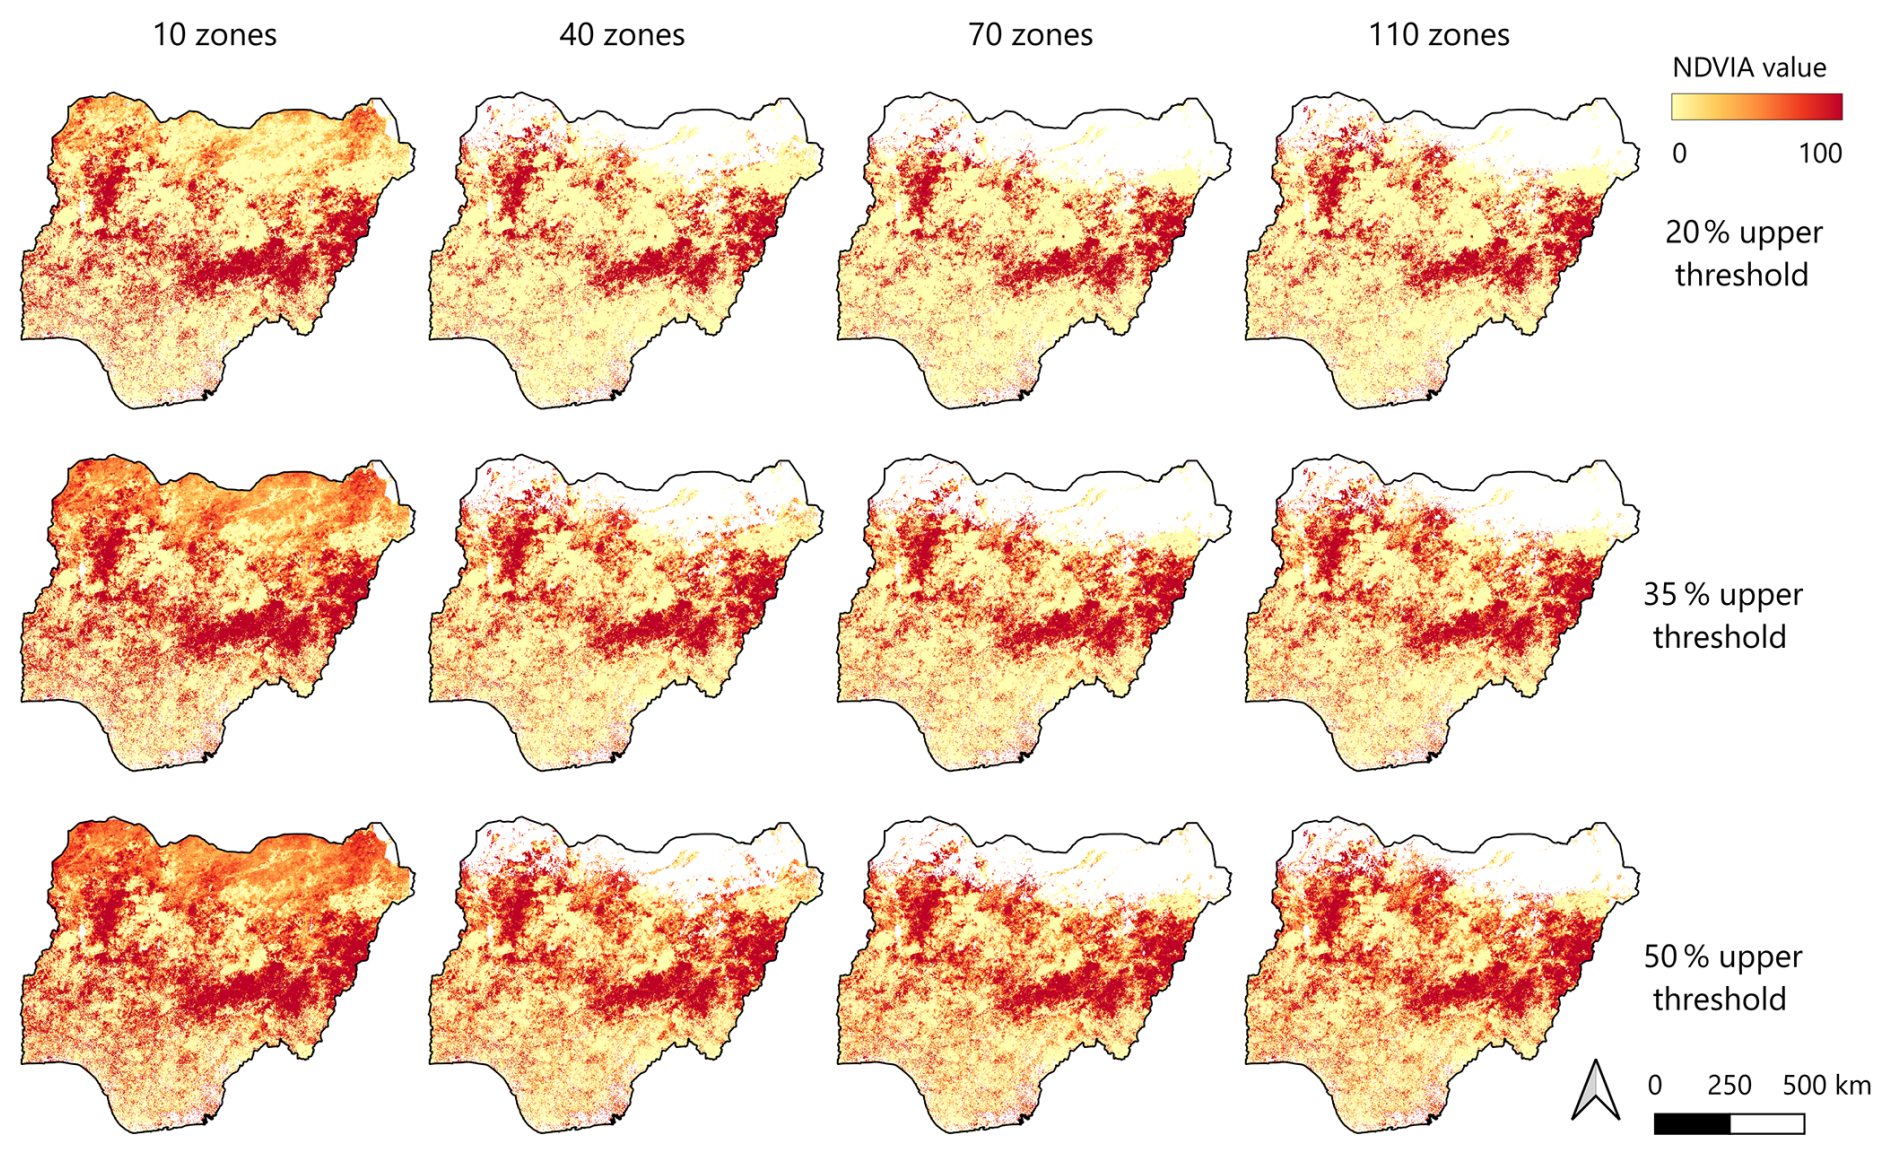
Figure 6NDVIA values for different combinations of zones and upper threshold values capturing anomalies in vegetation greenness during the dekad 11 June 2020.
3.3 Multivariate regression analysis
All available variables as described in Table 1 were used as inputs to multivariate regression models to predict drought impacts on annual yield changes per rice plot. Year-over-year changes in rice yields (as reported in farmer surveys) were used as the dependent variable, while assuming that fields and management practices remained largely similar. Adjusted R2 scores were used to account for the increasing number of input variables in the different models (Table 2). Of the farmer survey variables, neither soil type nor rice variety had any correlation with annual yield changes, and these survey variables were removed from subsequent models. The meteorological indices had the highest significant adj-R2 scores and were statistically significant for the 2024, 2020, and 2021 models. Both SPI and SPEI had notably higher scores than other variables when used as the sole model inputs, however they had intermediate scores when both indices were used as model inputs. The models incorporating all variables had lower adj-R2 scores relative to the meteorological variable models, suggesting that both collinearity and the impacts of the non-significant survey variables were detrimental to model accuracy. While the “All years” models had lower adj-R2 scores, there was still some predictive power for the multi-year models incorporating only meteorological variables. Notably, RMSE values differed between years, with 2024 models showing higher RMSE values, larger than typical rice yield values, while RMSE values for 2020–2023 were low in comparison.
Table 2Adjusted R2 scores and RMSE (in brackets) for annual and all year regression models trained with individual data categories, and all categories except anomaly variables (NDVIA, SWIA). Values in bold represent statistically significant model adjusted R2 scores (p > 0.05).
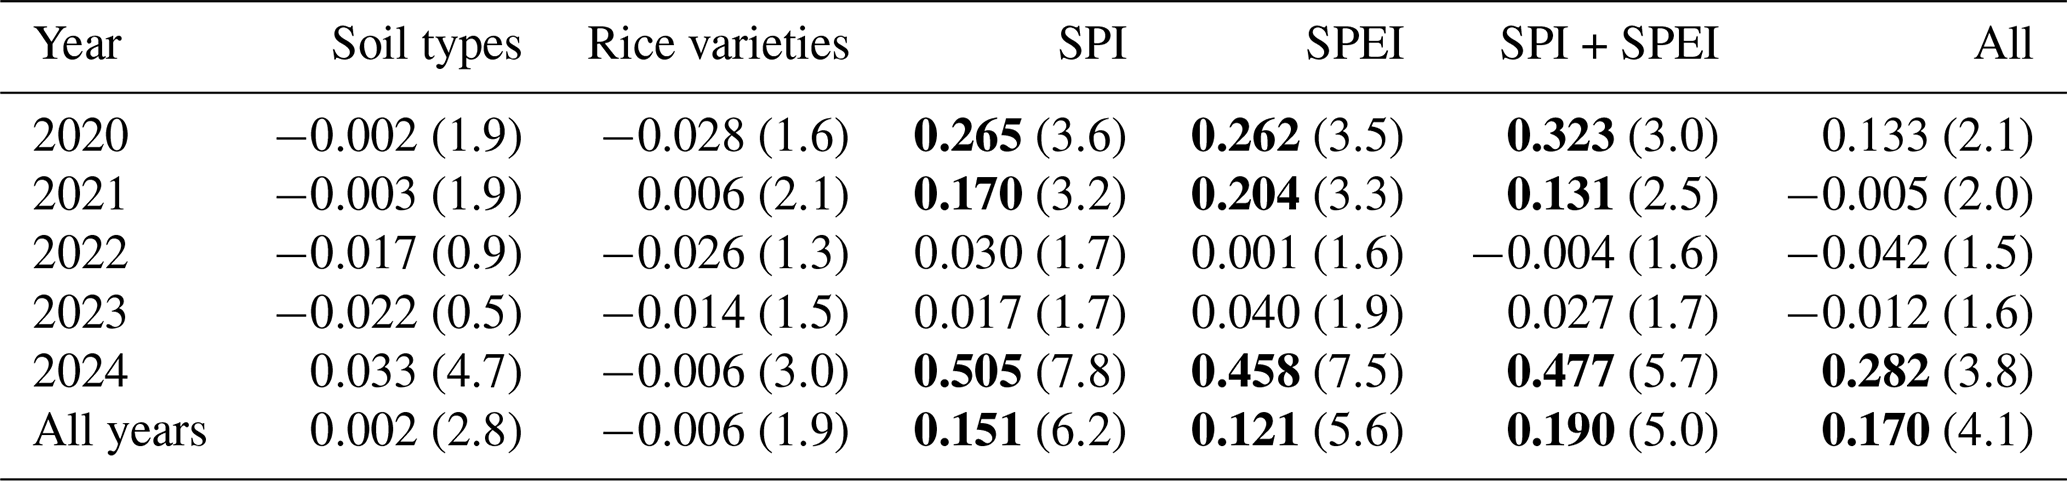
Table 3Adjusted R2 scores and RMSE (in brackets) for annual and all year regression models trained with individual aggregations of SPI and SPEI input variables. Bolded values represent statistically significant model adjusted R2 scores (p < 0.05).

As SPI and SPEI are calculated over different time windows (of the preceding 1-, 3-, 6-, and 12-month periods), we also compared the input variables from each index as separate inputs to multivariate regression models (Table 3). All SPI and SPEI aggregations had significant correlations with yield change values for the years 2020, 2021, and 2024, as well as for the “All years” models. Only SPI6 had a significant correlation with 2022 yield changes. SPEI generally performed better than SPI, due to the inclusion of evapotranspiration, which is a proxy for crop water demand. There was little difference in performance between the short-term and long-term indices, with the majority of the difference attributable to models trained on yield data from different years. All input variables' adj-R2 scores were both very low and not significant for the yield changes observed in 2023. The low adj-R2 scores of the “All years” model suggest there is high interannual variability, leading to model instability across years, preventing model generalization to other years. Furthermore, high RMSE values for 2024 suggest that while the models for that year have higher R2 scores, the spread of their predicted yield changes is very large, beyond the expected rice yield values for the region. This would affect the applicability of such a model for actual yield predictions and may have been due to large yield change values in the 2024 training data.
Anomaly variables calculated with incremental combinations of zone numbers and upper threshold values were used as inputs together with SPI and SPEI to multivariate regression models. Model adj-R2 scores, RMSE, and p-values were calculated for each model, and the improvement in adj-R2 compared to the highest yearly adj-R2 model as described in Table 2, was visualized (Fig. 7).
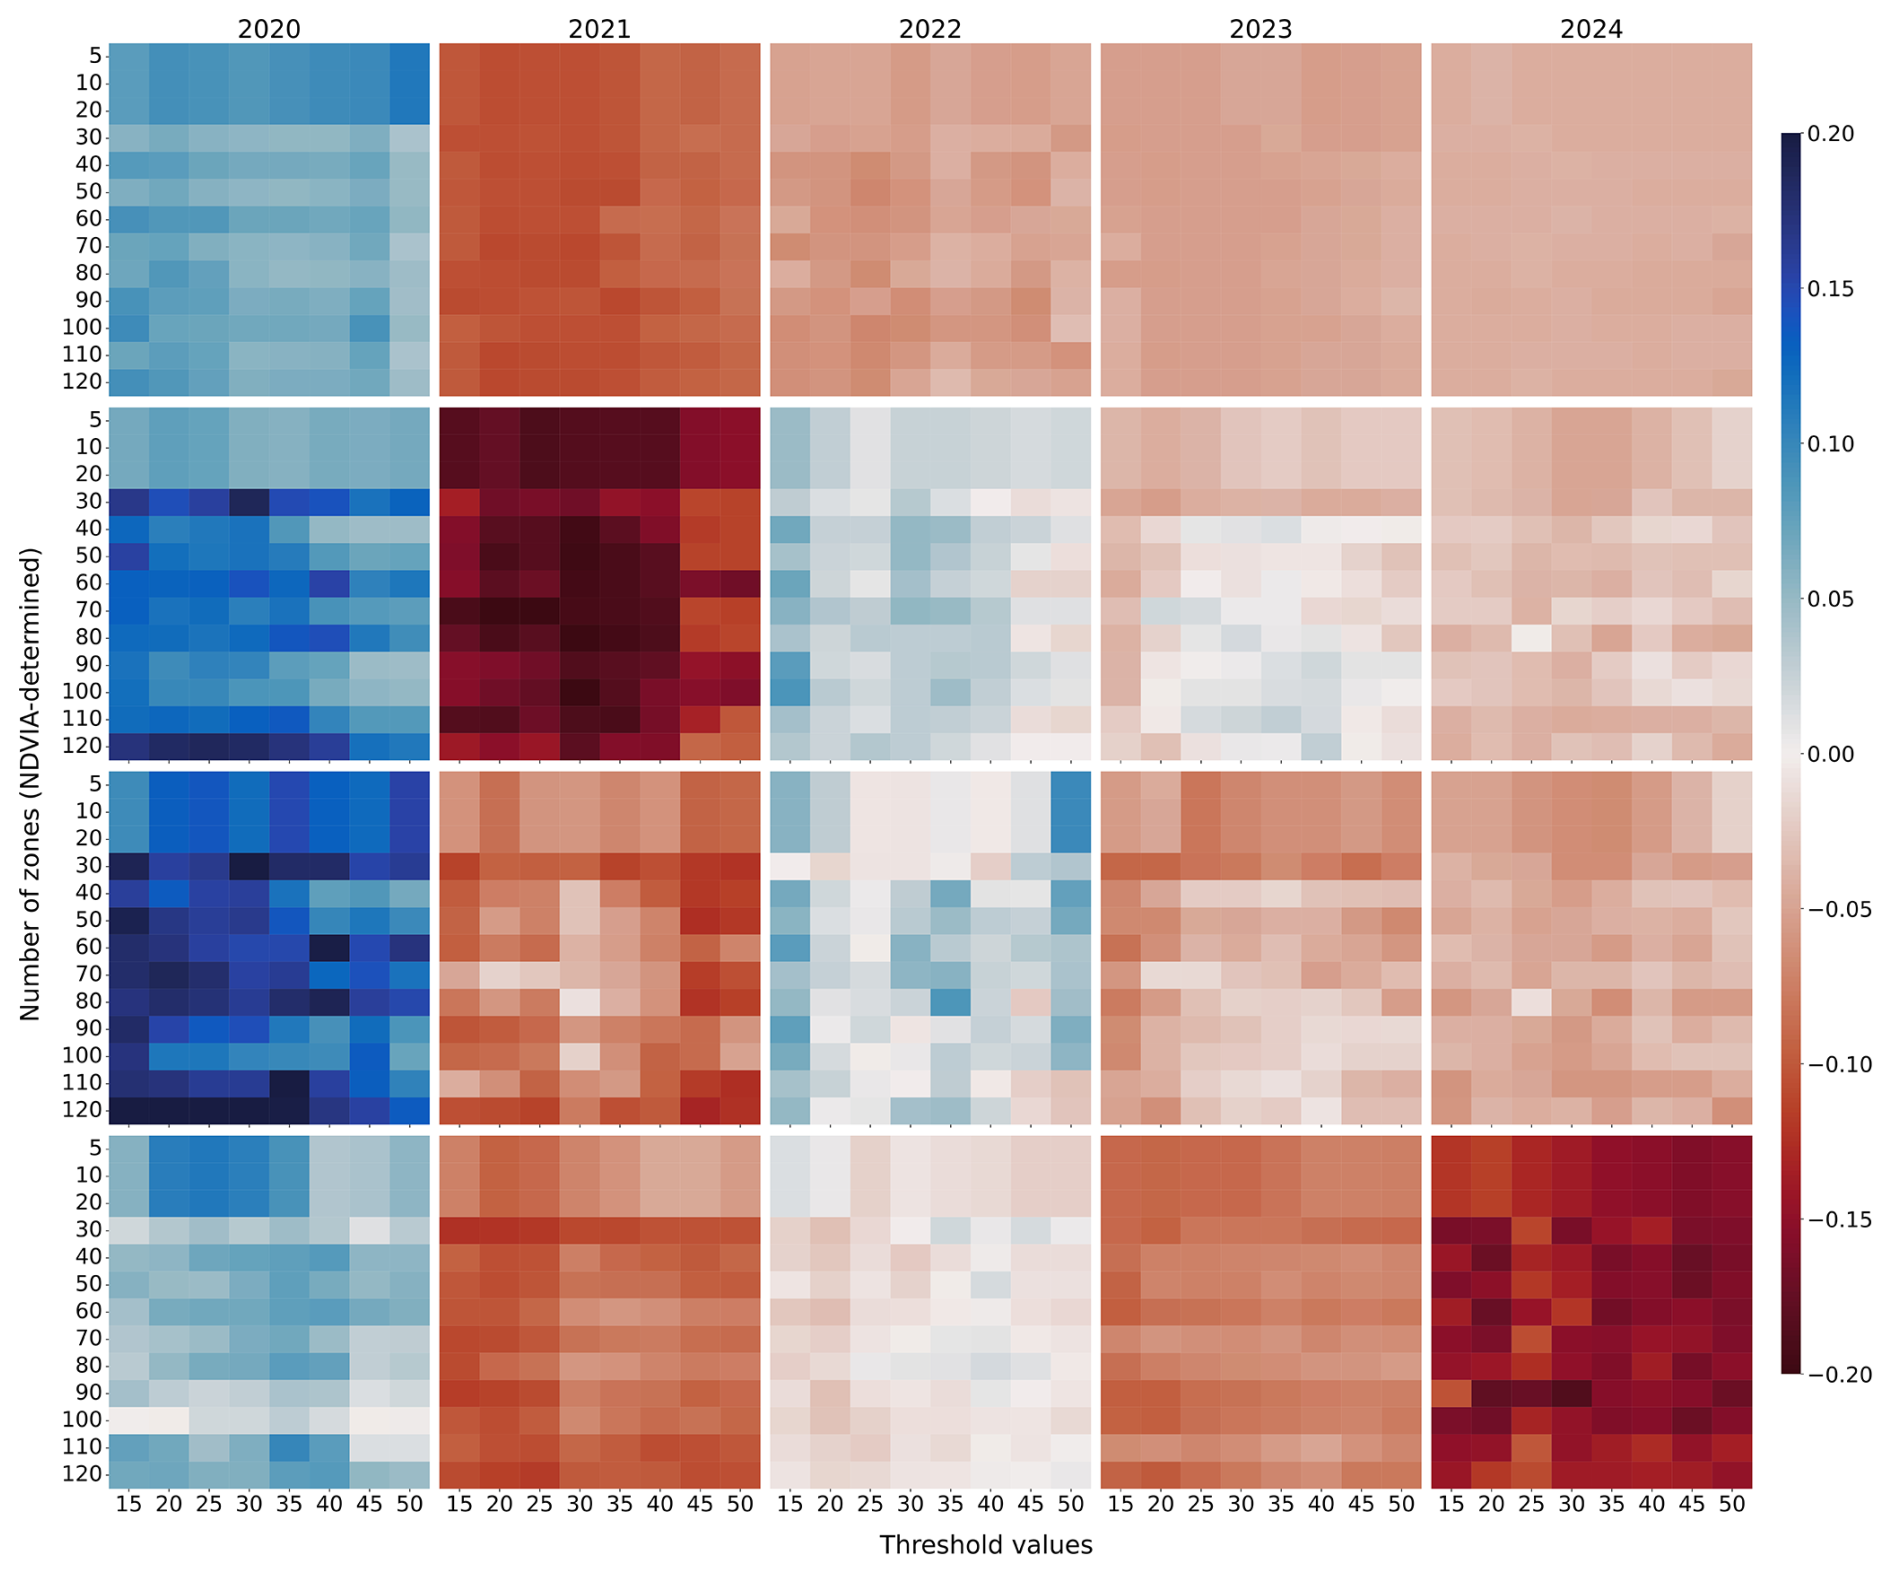
Figure 7Improvement in model adjusted R2 score relative to best annual model trained without anomaly variables. Improvement in model adjusted R2 shown for NDVIA (top), SWIA (second from top), combined (third from top), and only NDVIA/SWIA (bottom) for models with different combinations of zones and upper threshold values.
The addition of EO indicator anomaly variables improves the adj-R2 scores of the 2020 model more than for the other years. SWIA data was associated with increased the model adj-R2 more than NDVIA data, but the model incorporating both anomaly variables and meteorological variables (combined model) had the highest performance. Similarly, SWIA data improved model adj-R2 scores for the 2022 model, as well as slightly improving the 2023 scores. Notably, the models incorporating SWIA performed worse than those using only meteorological variables in 2021 and 2024. NDVIA data did not improve performance for the models of any other year and performed much more poorly than the meteorological-only model in 2021. For the combined model incorporating meteorological and anomaly variables, we observed the greatest improvement in adj-R2 scores for 2020, suggesting that both NDVIA and SWIA provided additional, complementary information that improved the regression results. Some of the 2022 models also improved adj-R2 scores more than models with a single-anomaly input. When meteorological variables were removed and only the EO indicator anomalies were used, model performance decreased, most notably in 2024. Improved model performance in 2020 persisted (albeit at lower levels), suggesting that both NDVIA and SWIA were indeed effective at improving model performance that year. Furthermore, for models with anomaly variables calculated with less than 30 zones, there is a banding pattern with identical model results. This is likely due to the uneven distribution of clusters in the KMeans algorithm, which despite creating up to 30 zones, tended to assign new cluster labels to smaller and more heterogenous zones outside the study areas. This resulted in identical zone delineation for low numbers of zones, and anomaly calculations thus also included a wider variety of pixels, resulting in less identified anomalies and many invalid (zero) anomaly values as model inputs. Zone complexity in the study areas tends to increase when clustering into more than 30 zones.
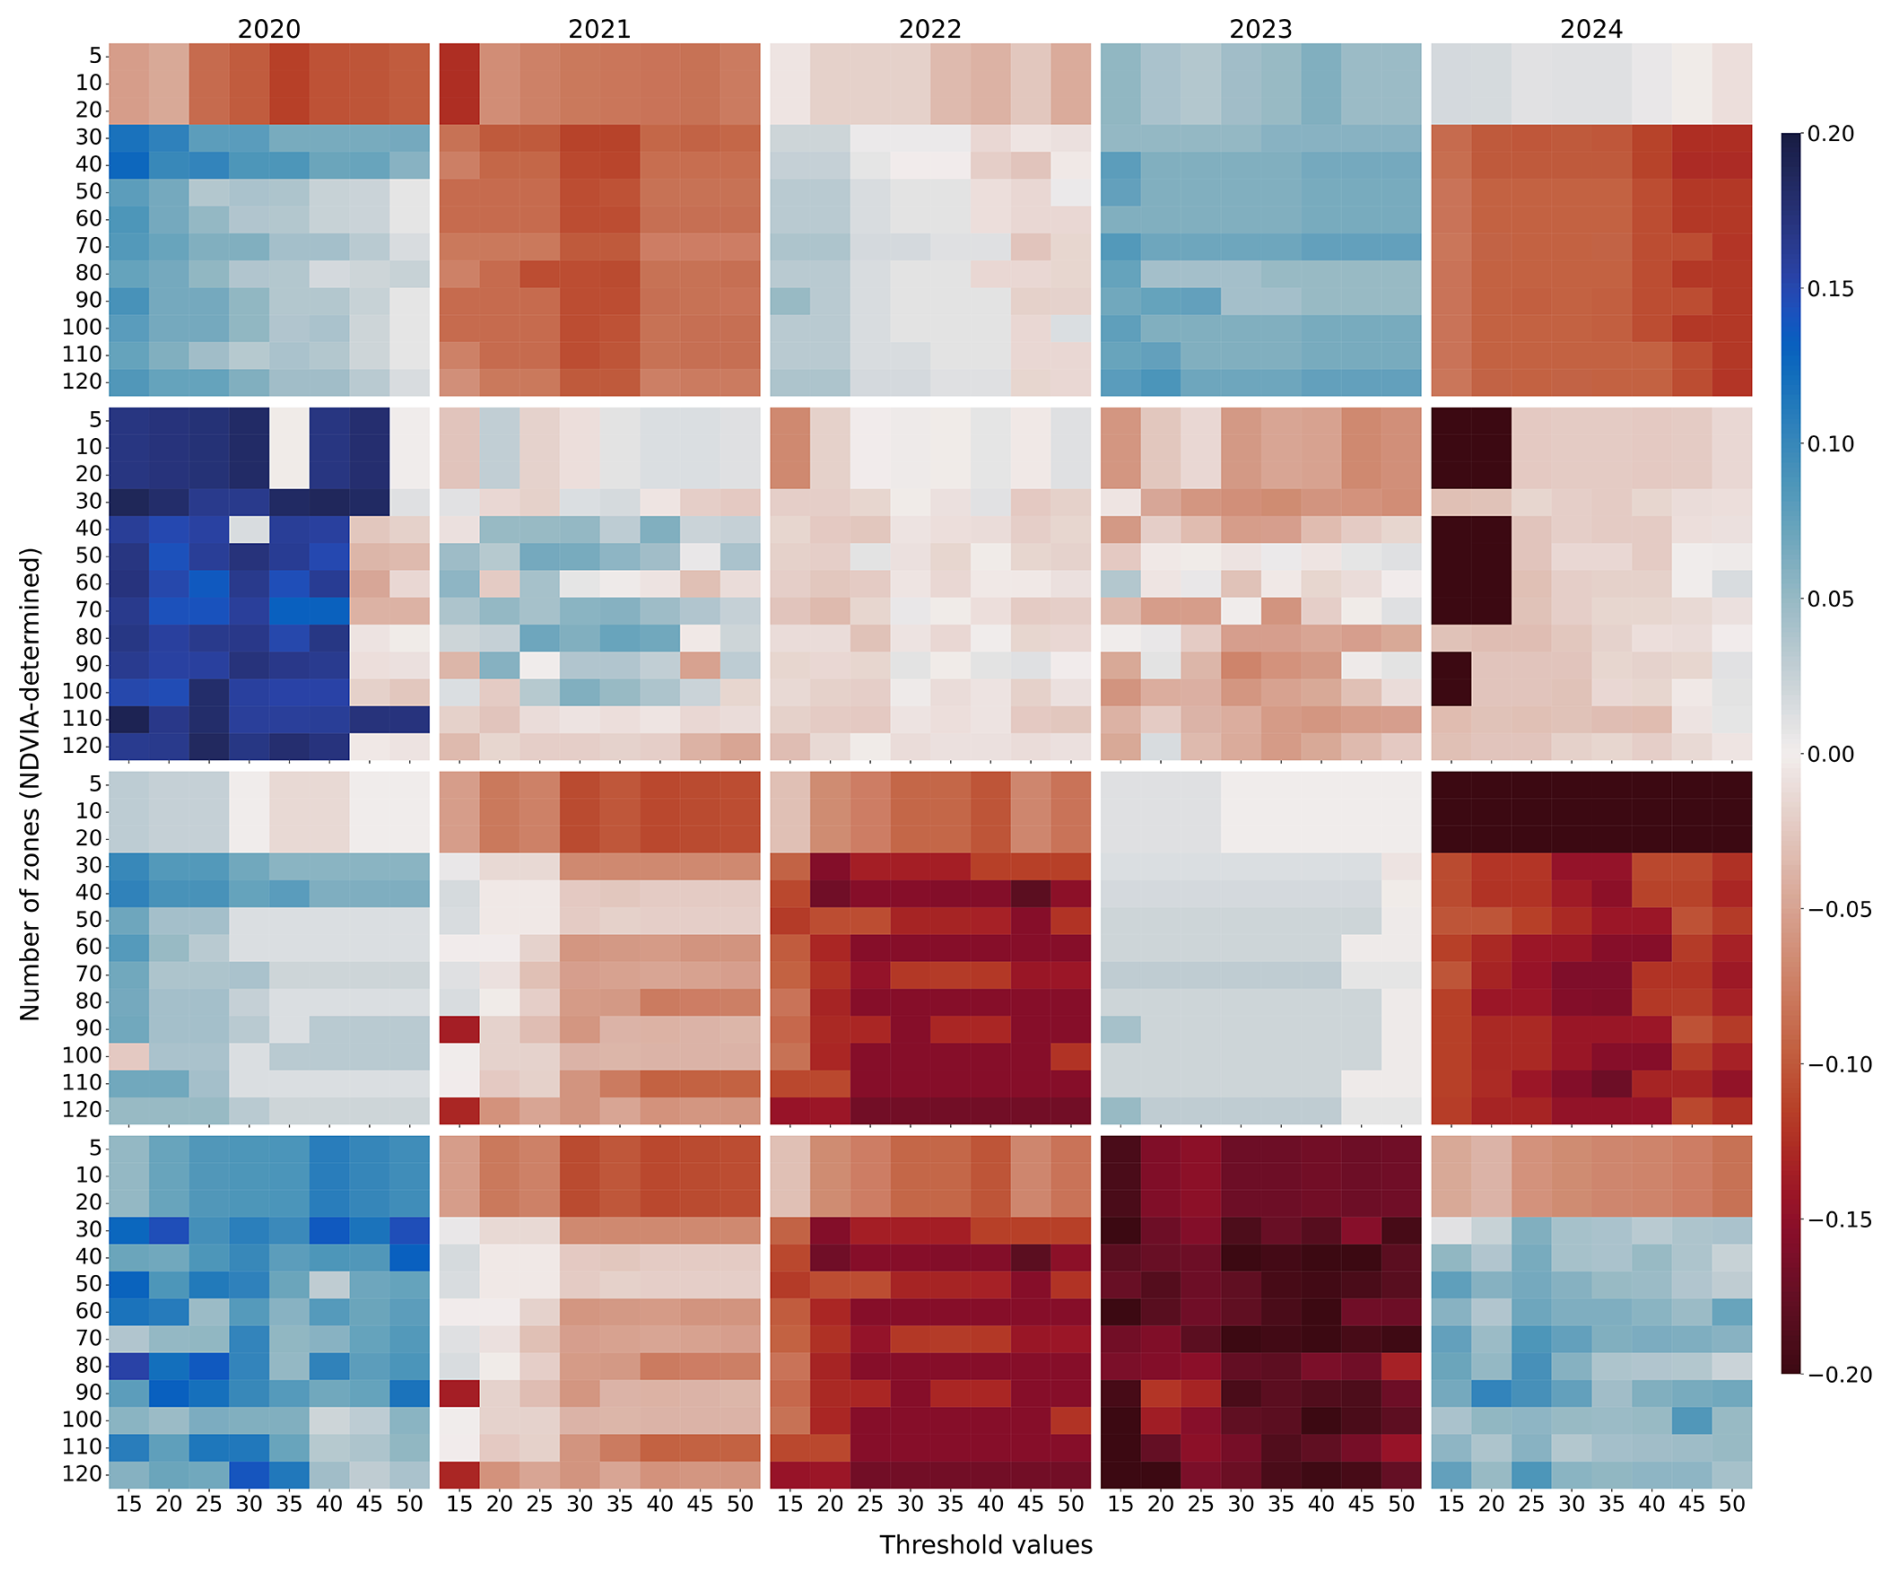
Figure 8Improvement in phenological model adjusted R2 score relative to best annual model trained without anomaly variables. Improvement in model adjusted R2 shown for NDVIA (top), SWIA (second from top), combined (third from top), and only NDVIA/SWIA (bottom) for phenological models with different combinations of zones and upper threshold values.
Finally, model performance was also assessed with phenological anomaly variables, for which statistics were calculated separately during the vegetative and maturity phenological stages of the rice growth season, based on average transplant and harvest dates for farmer plots in each state (Fig. 8). Looking at the phenological anomaly variables, NDVIA increases model performance in 2020, 2022, and 2023. Notable improvements are seen for 2023, a year that otherwise shows very low model performance. Phenological SWIA data increases model performance more than seasonal SWIA data, and there are also notable improvements for 2021, but some zone/threshold combinations reduce model performance, particularly in 2023 and 2024. The combined models do show some improvements, particularly below a 25 % upper threshold, and around 30–40 zones. However, the 2022 models show greatly reduced performance relative to the seasonal anomaly variable models. When using only the anomaly variables and no meteorological variables, both the 2020 and 2024 models show improvement in model performance, while 2023 model performance is greatly reduced. This suggests that while phenological NDVIA variables do improve model performance for 2023, they are complementary to meteorological variables rather than effective completely on their own. Some banding patterns were observed at low threshold values for phenological SWIA values in 2024, likely resulting from too strict an upper threshold in that year failing to identify dekads with anomalies and resulting in zero-value model inputs. Similar banding patterns were observed at low zone numbers as described previously, likely due to the same effect. Although there is no clear “best” combination or application framework, these results suggest that anomaly-based indicators provide complementary information, particularly in years with weak meteorological-yield relationships.
Generally, while the optimal number of zones or upper threshold value was unclear, some clear patterns were observed. Low zone complexity (under 30 zones) showed a banding pattern for both NDVIA and SWIA variables, potentially indicating that rice plots are contained within limited zones with few differences, leading to similar NDVIA/SWIA values and lower adj-R2 scores due to similar model inputs. Increased zone complexity improved model performance for models with only SWIA and meteorological variables, particularly when using seasonal rather than phenological stage statistics. However, a slightly higher model performance was observed around 50-70 zones for the seasonal SWIA and combined (2020 and 2022) and phenological NDVIA (2023) model, and around 70–100 zones for the phenological SWIA (2021) and NDVIA/SWIA models (2020 and 2024). This suggests that a zone complexity of around 70 zones could provide higher correlations between anomaly variables and rice yield changes across multiple years, however it is important to note that there is no clear “optimal” zone number, and the optimal zone range does vary year to year. While increasing the upper threshold percentage did increase the number of dekads identified as anomalies by both NDVIA and SWIA (Fig. 5), it did not necessarily improve the correlation between anomaly variables and rice yield change. For both seasonal and phenological NDVIA and SWIA variables in 2020, reduced model improvement scores are seen at upper threshold values above 35 %. For numerous combinations of input variables and years, upper threshold values of 15 % or 20 % show the highest model improvement scores. This may be because at these threshold values, the NDVI/SWI value that is identified as an “anomaly” is limited, resulting in a more specific definition of drought dekads, and leading to higher correlations and greater explainability of annual yield change values. Model errors vary across years and model types (Fig. A4), with the highest RMSE values observed for models using 2024 data and for NDVIA/SWIA (both seasonal and phenological). High RMSE values for 2024 data may be explained by the greater variance of yield data for that year, despite relatively high adj-R2 scores and good explainability by meteorological variables alone.
3.4 Modelling of individual years and regions
The predictive capacity of the multivariate regression models to estimate rice yield changes from meteorological variable and anomaly indicator inputs depended on the year, and generally followed the patterns observed in Figs. 7–8. Figure 9 visualizes model predictions for a multivariate regression model fit on both meteorological variables and anomaly indicator values calculated with 70 zones and an upper threshold value of 20 %. Other combinations of zones and upper threshold values showed a similar grouping of results. While the mean values of both predicted and reported yields remained similar, in the years 2020, 2021, and 2023, the models tended to overestimate positive yield changes. In both years 2022 and 2024 yield change predictions were more evenly distributed, but with higher errors for negative yield changes, while positive yield changes (increasing yields year-over-year) followed a more clustered 1 : 1 relationship. Figure 9 suggests that the model predictive capacity was better at more neutral yield changes (closer to 0 t ha−1), while for points towards the extremes of increasing or decreasing annual yield changes, the model was less capable of predicting accurate yield change values.
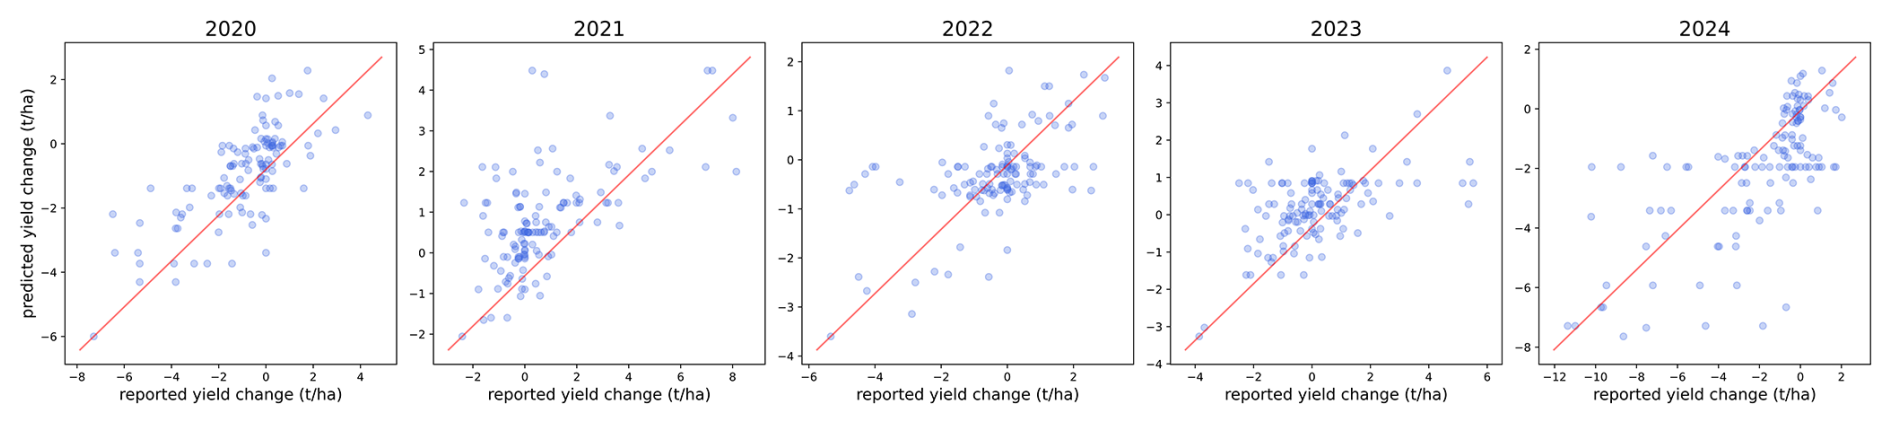
Figure 9Annual rice yield changes predicted by model including meteorological variables (SPEI/SPI), and anomaly indicators (NDVIA, SWIA) calculated with 70 zones and an upper threshold value of 20 % versus annual rice yield change values as reported by farmers, per individual rice field. Red line indicates 1 : 1 reported vs predicted relationship.
Clear differences were observed at the state level in the performance of NDVIA/SWIA variables in describing annual changes in rainfed rice yields during drought periods. In the majority of surveyed locations, droughts reported by farmers aligned with NDVIA and SWIA results, but it was evident that the timing of the drought played an important role in yield impacts. For Niger state, the state with the highest number of surveyed rice plots, 2024 had the highest number of drought months reported by surveyed farmers (Fig. 10). During the 2024 growing season, both SPI3 and SPEI3 decreased around April, after transplanting started. This decrease corresponds to some high NDVIA values, indicating a negative anomaly in vegetation greenness over the rice plot pixels, consistent with the effects of an agricultural drought. The large decrease in SPI3/SPEI3 values continues throughout the rice tillering stage and into the panicle initiation stage in August, where both indices remain below −2.5, only increasing slightly during the flowering and grain-filling stages. During this period, SWIA anomaly values remain mostly constant throughout the panicle initiation and flowering stages. This indicates a deficit of soil moisture that can affect rainfed rice crops, especially during key stages for drought impacts on rice yields. Ultimately, the drought effects in 2024 are already quite well delineated by meteorological variables, while SWIA aligns well with farmer-reported drought periods. Rice yields in Niger state were relatively stable in 2023, with some yield increases, while SPI3/SPEI3 values were higher during all stages of rice growth. SWIA and NDVIA also showed very few anomaly values. SPI3/SPEI3 values were negative during the panicle initiation and maturity stages of 2022, and both NDVIA and SWIA values showed higher peaks, despite stable yields relative to the year prior. 2021 stands out as an outlier, with high NDVIA and SWIA values, as well as decreased SPI/SPEI values indicating agricultural drought during all stages of rice development, despite farmers reporting yield increases during that year. Finally, 2020 shows relatively high SPI3/SPEI3 values, but high SWIA values during the maturity stage align with yield decreases reported by farmers. This may in part explain the high improvement in model performance by adding SWIA variables for 2020 model inputs.
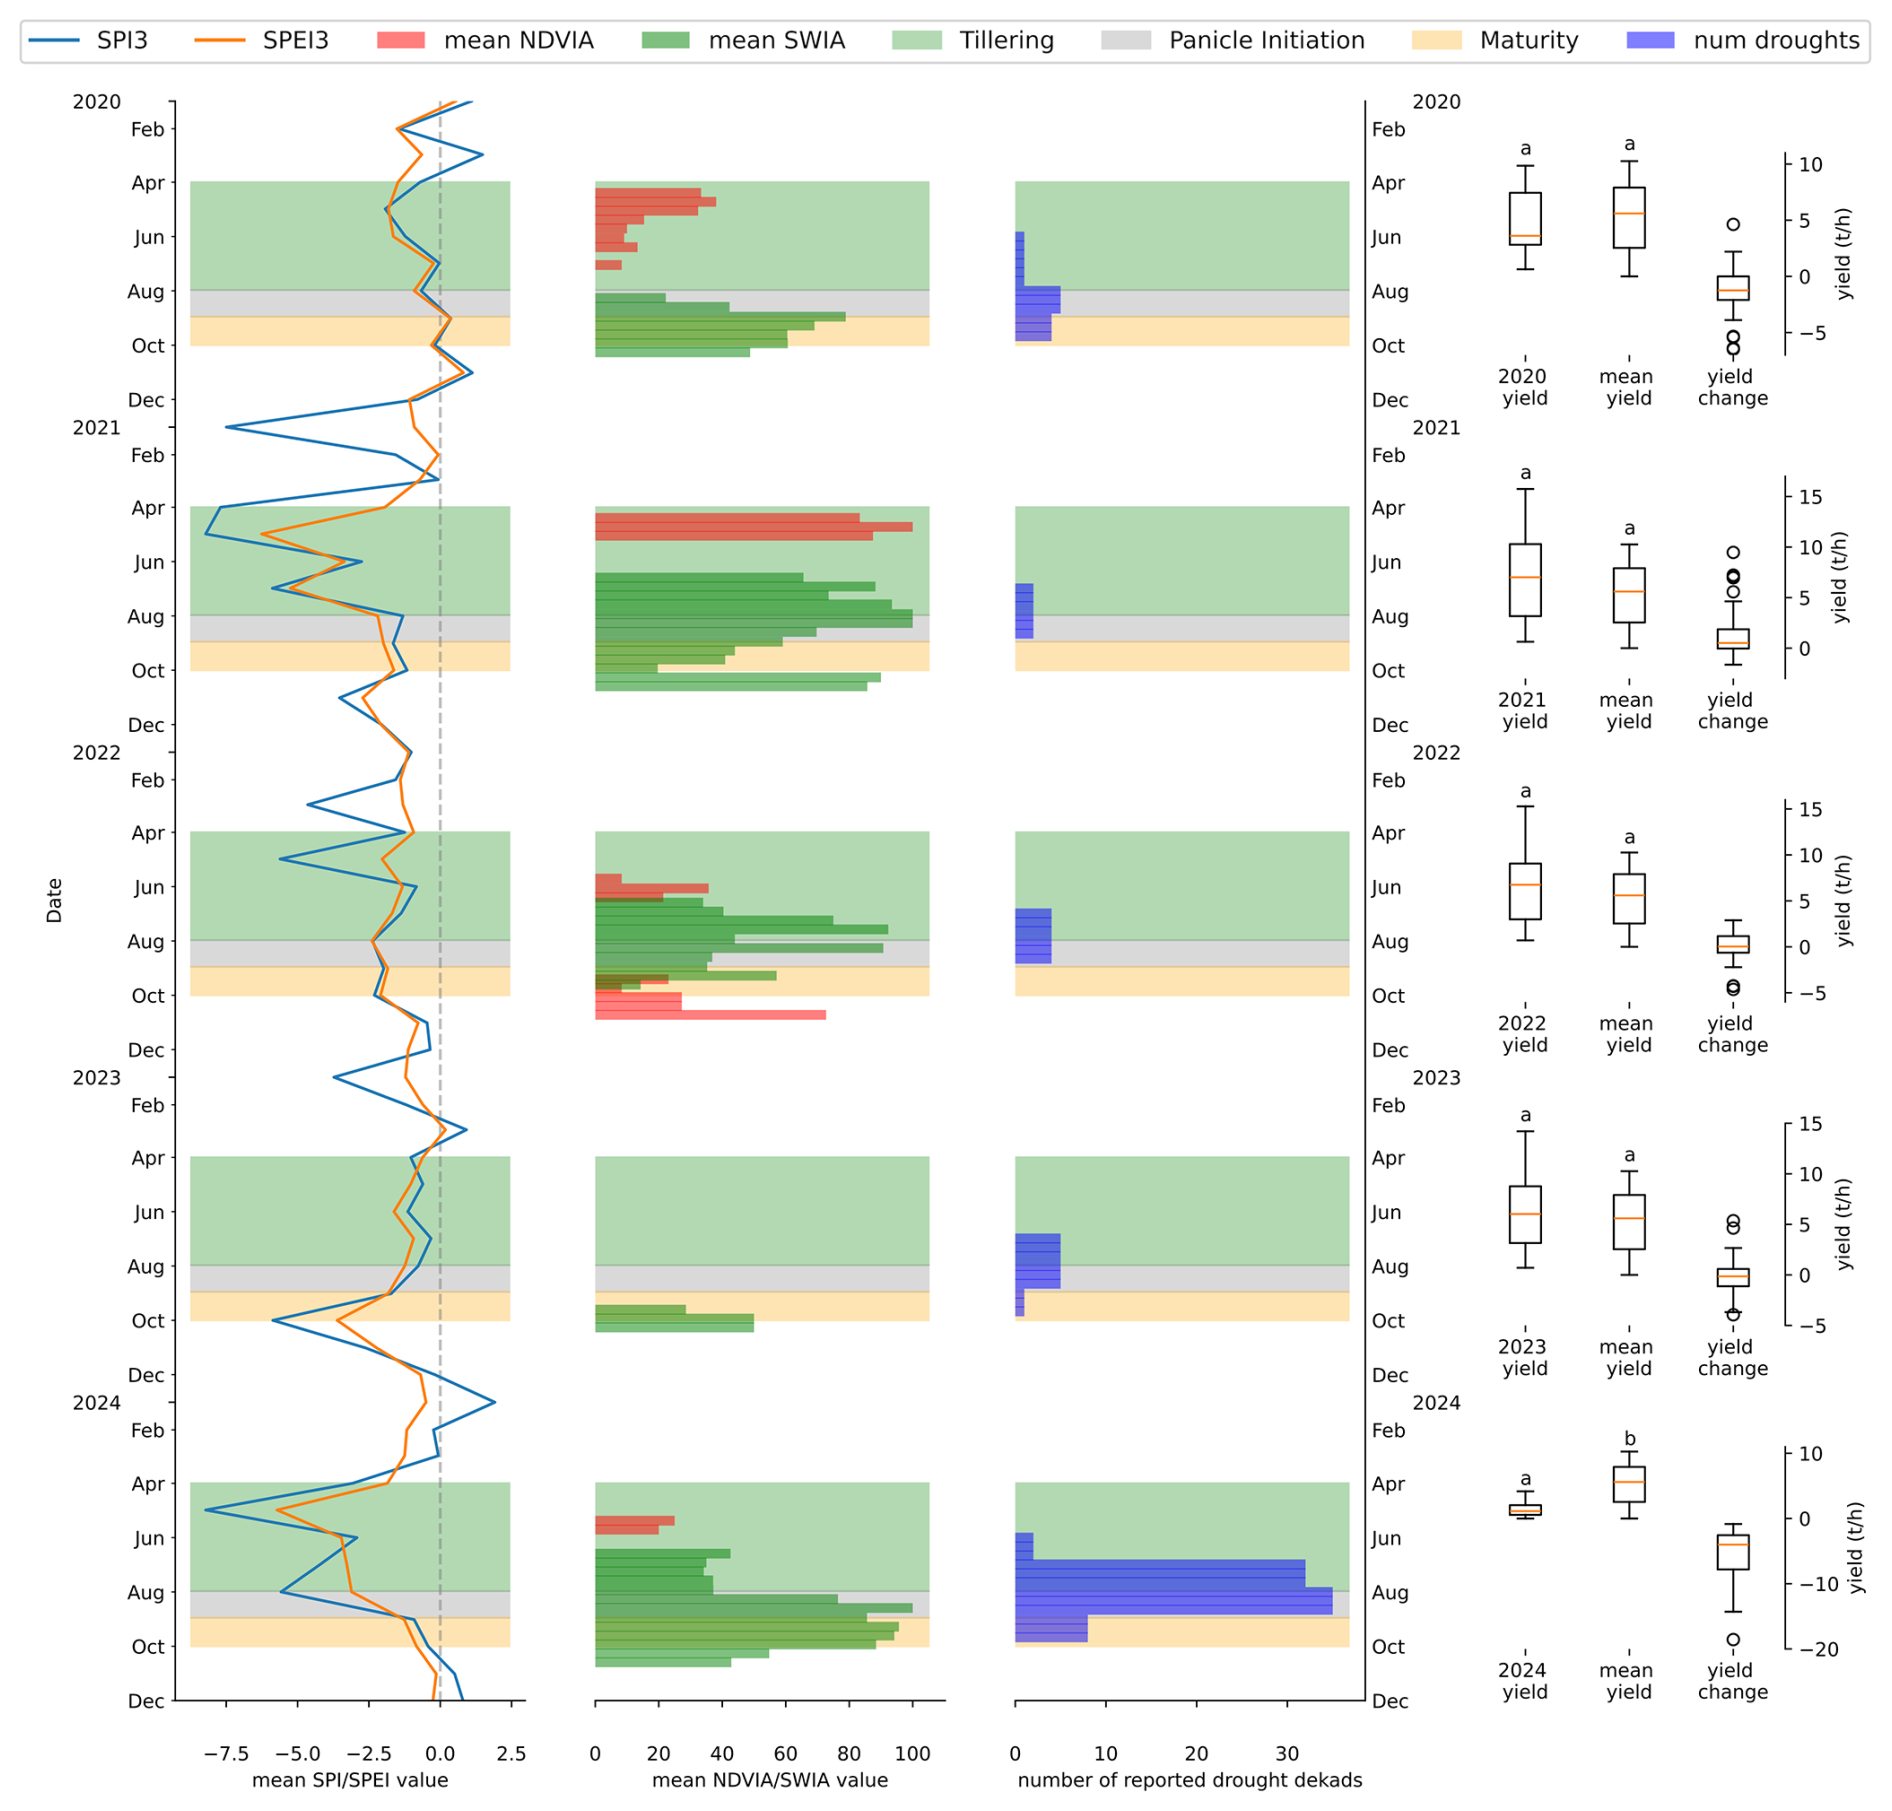
Figure 10Summary graph comparing meteorological variables (SPI3, SPEI3; left), anomaly variables (NDVIA, SWIA; centre left), farmer-reported drought periods (centre-right), and annual/5-year mean yields (right) for Niger state. Anomaly variable values are derived from 70 zone and 20 % upper threshold equation parameters. State-specific rice growth calendar shows different stages of rice development according to field survey results: vegetative growth/tillering (green), panicle initiation (grey), and flowering/grain-filling (yellow). Statistically significant differences (Student's t-test, p < 0.05) between annual and 5-year mean yields is shown via letters (a, b) above boxplots.
High NDVIA values during the tillering phase, decreasing towards panicle initiation as SWIA values increase, were observed for all four states, especially during the years 2020, 2021, and 2024 (Figs. A5–A7). Nasarawa state notably showed much higher NDVIA/SWIA values, aligning well with both farmer-reported drought dekads and reductions in yield for almost all years. This state also had high SWIA values throughout almost the entire rice-growing season, even at reduced upper threshold values (under 30 %). The high SWIA values observed in this state are also decoupled from SPI3/SPEI3 patterns, suggesting that SWIA captures changes in soil water availability that are not easily explained by changes in precipitation/evaporation patterns. At the same time, these increases in SWIA align well with farmer-reported drought dekads. Ebonyi state shows stable SPI3/SPEI3 values during the panicle initiation and maturity stages of 2022 and 2023, which also correspond to NDVIA/SWIA zero values throughout the entire growing season for both years. This also aligns with almost no yield changes reported by farmers during those years. 2024 in Ebonyi state had a small drought early in the rice growing season, which is captured both by the meteorological indices as well as anomaly variables. However, this drought did not have a large effect on yield values. However, Ebonyi state had high NDVIA values early in the 2020 rice growing season, which could have contributed to the improvement in model performance for that year. Ogun state had fluctuating yield change values with many outliers which do not align well with neither SPI3/SPEI3 nor NDVIA/SWIA dynamics. This may have been due to a shifting cultivation system practiced in the state, which suggests that farmers may not have retained the same rice plots year-on-year. However, it's important to note that there were only a few plots in this state, suggesting too low a sample size to draw accurate links between drought detection indices and farmer-reported rice yields at the state level.
Rainfed rice production in the study areas faces clear challenges due to drought, as evidenced by farmers' self-reported yield losses due to droughts over the duration of the study period. Existing meteorological indices are not always sufficient for monitoring drought impacts on rice yields, and regression models exhibit low predictive power for yield changes in years and locations with complex drought patterns. The four states surveyed in this study also have different management practices, environmental conditions, and sometimes even different rice varieties grown by farmers. FARO 44, the most common variety grown by surveyed farmers, is drought-resistant (Afiukwa et al., 2016), demonstrating that farmers are already adapting to changing climate conditions. However, both FARO 44 and OFADA, the second most common rice variety grown by surveyed farmers, show negative impacts on grain formation and grain yields when droughts occur during the panicle initiation and grain-filling stages (Akpoilih and Dada, 2025). Furthermore, survey results collected in this study showed that nearly 99 % of surveyed farmers use alert systems to receive early warnings of droughts, with the majority relying on radios and extension officers as their source of early warnings. These warnings are important for farmers to be able to react to coming droughts, either by accessing financial resources to absorb the economic shock, implementing basic irrigation if possible, or changing rice varieties or planting schedules; despite most smallholder rice farming households maintaining a low level of resilience to water insecurity shocks (Kim et al., 2017; Sanusi and Dries, 2025). The developmental stage of a rice crop at which agricultural drought occurs has different impacts on final yields, with drought stress throughout the panicle initiation stage resulting in severely reduced yields (Boonjung and Fukai, 1996). Furthermore, farmers' survey responses show that the majority (58 %) experienced major yield losses due to droughts, specifically during the panicle initiation stage of rice crop development. The reported patterns of yield changes (Fig. A1) and reported drought experiences are largely supported by the anomaly results in this study, specifically with SWIA capturing soil water anomalies during the later stages of the rice growing season and correlating well to negative yield changes, suggesting that monitoring seasonality of drought events is important for understanding their impacts on rice yields.
Annual temporal differences in NDVIA/SWIA patterns over the surveyed rice plots align with NiMet seasonal climate predictions and farmer bulletins, which show a variety of different rainfall patterns and crop impacts throughout the study areas. In 2020, there was a mid-season cessation of rains for 5–6 weeks in July and August across both Niger and Nasarawa, and a shorter dry spell in Ebonyi state (NAERLS and FMARD, 2020). The timing of these droughts directly overlapped with the reproductive and maturity stages of the rice crops in those states. These reported droughts do align with non-zero NDVIA and SWIA values in Nasarawa and Ogun states (Figs. A6, A7), as well as later season SWIA in Niger state (Fig. 8), potentially due to lag-time effect (Guo et al., 2026). Higher rainfall was reported across the country in 2021, although Niger and Nasarawa states experienced moderate dry spells (NAERLS and FMARD, 2021). These are also clearly visible in the mid-season increase in SWIA for both states. Ebonyi state (Fig. A6) also shows a peak in SWIA values, however this occurs earlier in the season and does not have a significant impact on yields. SWIA values also peak later in the rice growing season in Ogun state, also without a significant impact on yields. Severe floods occurred in 2022 from June to October, particularly affecting Nasarawa and Ebonyi states, with more minor impacts on Niger state (National Bureau of Statistics, 2023). This aligns with reduced anomaly values in Nasarawa state, and no observed anomaly values in Ebonyi state. NiMet bulletins and a post-season survey show that 2023 was an uneventful year in terms of drought, with normal rainfall generally, and some floods in Ebonyi state (NAERLS and FMARD, 2023; NiMet, 2023). Rice plot pixels in all states (except Nasarawa) show drastically reduced anomaly values in 2023 and almost no impact on rice yields. Finally, a nationwide dry spell was reported earlier in the rice season in 2024 with moderate to severe conditions in all states in this study (NiMet, 2024). However, this was later followed by excessive rainfall, sometimes resulting in flooding that affected rice fields (NAERLS and FMARD, 2024). For all four states, this is the year in which SPI3/SPEI3 values most closely follow the reported drought occurrences, whereas anomaly variables do not. Lower SPI3/SPEI3 values (particularly during the panicle initiation stage) are associated with significantly reduced rice yields in Ogun and Niger states, while the other two states show earlier drops in precipitation that do not align with reduced rice yields, further supporting the argument that the panicle initiation stage is an effective moment to use drought indices for monitoring drought impacts on rice yields (Boonjung and Fukai, 1996).
The drought patterns reported by NiMet in the study region may help to understand the multivariate regression model results for both the seasonal and phenological anomaly variables and rice yields. Despite reported drought impacts in 2020, SPI3/SPEI3 remain high, except in Ogun state. In contrast, SWIA/NDVIA peak, particularly in Niger and Nasarawa states. Phenological NDVIA variables are the only inputs that improve model performance in 2023, which could be partially explained by non-zero NDVIA values during the vegetative and panicle initiation stages in Nasarawa state, whereas there are very few anomaly values in other states. While it was difficult to understand exactly why phenological NDVIA improved model performance for some years, these results align with Zhang et al. (2019), who found that NDVI during early and mid-growth stages could be used to predict rice grain yields. Notably, Nasarawa state has the highest NDVIA/SWIA values for almost every year, and even the least sensitive zone/upper threshold combinations showed high anomaly values for Nasarawa. Lay et al. (2026) note that Nasarawa state is a particularly drought-prone region in North-Central Nigeria, which could explain the especially high anomaly values. Regional differences that were difficult to control for may account for the discrepancy in model adj-R2 scores between years – especially as in Nasarawa, high SWIA values seem disconnected from the relatively high SPI/SPEI values during the tillering and panicle initiation stages. In Ogun state, decreased yields are particularly noticeable in 2020 and 2024, which have high SWIA values during the flowering/grain filling stage. Individual points also had large impacts on model adj-R2 scores for some years, for example due to high yield variance in 2024 (which also explains higher RMSE values for that year; Fig. A1). Additionally, larger field sizes and higher yields were recorded for multiple surveyed locations in Nasarawa state, along with clay soil types that indicate a tendency towards water retention and external water supply to supplement rainfall. During fieldwork, it was also noted that some farmers (particularly in Ogun state) cultivated rice over two seasons and counted total rice yields, while others had external water sources that were difficult to document during fieldwork. These factors may have impacted the effectiveness of both meteorological and anomaly variables in predicting annual rice yield changes.
The ideal number of zones and threshold values for anomaly variable calculations had a large impact on both the calculation of EO indicator anomaly values, as well as the results of the multivariate regression analysis. Zones were calculated using seasonal NDVI patterns across the country, which did not show clear separation between zones, making it challenging to cluster pixels, as there was no “best” solution for the optimal number of clusters beyond basic aridity-based zoning. There is a minimum number of zones necessary for more accurate drought predictions, but this is due to the KMeans clustering algorithm which assigns smaller zones to more heterogenous pixels in the south, while grouping the majority of northern pixels together for lower zone numbers (Fig. 3). Once this minimum zone number (around 30–40 zones) is surpassed, drought pattern predictions remain largely similar for increasing numbers of zones. This is evident in Figs. 6 and A3, where anomaly values during high NDVIA/SWIA events in 2020 don't noticeably change beyond 40 zones. This aligns with Adefisan and Abatan (2015), who created a zoning system for Nigeria based on diverse drought and rainfall patterns, ultimately resulting in a three-zone system largely based on the rainfall gradient, similar to the spatial distribution of zone clusters beyond a zone number of 30. This finding goes against the use of 100+ zones for the determination of anomaly values, however previous studies have focused on index insurance applications, which have different end goals. While Kirchner et al. (2025) found that increased number of index insurance zones could provide more tailored insurance for farmers, they caution that too many zones can increase the variance within each zone and necessitate more field data to reduce insurance risk. Increasing threshold values increased the number of dekads with drought anomalies for both SWIA and NDVIA, although the greatest change in the number of drought dekads occurred around the 30 % threshold. Below that threshold however, drought dekad detection was more specific to drought as it related to yield changes for rainfed rice farmers and led to better model performance with the addition of anomaly variables. This is also observed in Figs. 6 and A3, where increasing upper threshold values do identify more anomaly pixels, but these anomalies are not necessarily more specific to the occurring drought events that cause said anomalies. This aligns with Bayissa et al. (2019), who defined drought intensity according to percentage deviation from combined drought index values, with 30 % and 20 % rankings corresponding to abnormally dry and moderate drought categories, respectively. This is relevant for applications such as index-based crop insurance, where area-specific risk and index thresholds can determine farmer payouts in the event of droughts (Bayissa et al., 2019). It further aligns with the previous use of anomaly variables for monitoring agricultural drought (Eze et al., 2020).
Both meteorological indices used, as well as the anomalies calculated from NDVI and SWI data, had large degrees of collinearity, ultimately affecting model accuracy. Initial principal component analyses showed similar patterns across non-anomaly variables, with SPEI more effectively capturing drought impacts on yield changes, aligning with previous studies (Tirivarombo et al., 2018). Significant adj-R2 scores for meteorological indices align well with the successful use of SPI/SPEI to predict drought impacts on cereal yields in Africa as observed in previous studies (Makuya et al., 2024; Tirivarombo et al., 2018). Our results show that, despite collinearity among individual variables and across variable sources, the addition of both NDVIA and SWIA improved model accuracy in predicting yield change, especially in years when meteorological variables alone were insufficient. Despite the model improvement, the adj-R2 values are still relatively low, indicating that there are more complex factors leading to rice yield changes than those that can be modelled with soil moisture and vegetation anomalies and meteorological variables alone. Anomaly variables do not add much yield explainability for years when meteorological variables already provide high model adj-R2 scores (such as 2024). But for years when yield change is less accurately explained by meteorological variables, such as 2023, anomaly variables are valuable for identifying periods of drought and understanding the impacts of those drought periods on rice yields. These results align with previous research: Winkler et al. (2017) demonstrate that vegetation indices, in particular VCI, are able to detect much smaller-scale agricultural droughts and demonstrate different patterns of drought detection relative to purely meteorological indices. Similarly, we understand that the spatial resolution of NDVI/SWI data used in this study encompasses more than just the individual rice plots, or rice-producing regions. Multiple land-cover and land-use types exist within each pixel, ultimately influencing the spectral signal that indicates vegetation stress. Because small-scale irrigation or field improvement techniques (such as bunding) may be present at the field level, it is a challenge to fully disentangle the rice crop stress signal and thus the impacts of drought events on rice yields. Furthermore, Boschetti et al. (2013) note the disconnection between rainfall and vegetation greenness patterns in West Africa is often driven by human activity, which was difficult to account for entirely within this study.
Temporal patterns of EO indicator anomalies and their relationship to changes in rainfed rice yield differed across the states investigated in this study (Figs. A5–A7). Many years and states show NDVIA values peaking during the tillering stage of the rice season and decreasing as the rice crops approach the panicle initiation stage. The vegetation greenness anomalies during this period seem to be linked to changes in precipitation: SPI3 values were also low during each increased NDVIA period, however, SWI anomalies are only identified later in the season. This could be due to differences in the response time lag of the two anomaly variables to precipitation changes. The use of the SWI layer with a T latency factor of 40 d (Raml and Bauer-Marshallinger, 2018) further supports that SWIA values describe the impacts of low precipitation earlier in the season on later-season soil moisture, while NDVIA values may be more immediately responsive to changes in precipitation. Guo et al. (2026) found that the water use efficiency of African agroecosystems was particularly susceptible to deep soil moisture, and both NDVI- and SWI-derived indices had differing lag-times to meteorological drought (as determined by SPEI). In particular, the deep soil moisture (at 40–100 cm, including the SWI depth used in this study), was responsible for the most variation in agroecosystem water use efficiency, supporting our findings regarding SWIA as an effective variable to monitor agricultural drought impacts on rice yields. Lag time between soil moisture and SPI varies by SPI term, with SPI-1 and -3 showing little to no lag, whereas long-term SPI layers exhibit lags of multiple dekads (Cammalleri et al., 2024). Conversely, in the Horn of Africa, Odongo et al. (2023) found that arable land had a shorter (1 to 4 months) accumulation period during which the effects of meteorological drought would impact soil moisture. This may help explain the late-season increase in SWIA values observed in many states, leading to eventual yield impacts. The early- and mid-season non-zero NDVIA values observed in this study also align with Medida et al. (2023), who further note that soil texture was an important factor in the correlation between precipitation and vegetation stress. The aggregation of anomaly values into different phenological stages throughout the growing season did in fact improve model performance, particularly for NDVIA in 2023 and for SWIA in 2021. This suggests that EO indicator anomaly values at specific points in the growing season can be used for monitoring the impacts of drought on rice yields.
The variability in crop management practices among individual farmers across states, as well as the heterogeneity of crop and land cover for individual pixels, presented serious challenges to the development of a “one-fits-all” model, as evidenced by the lower performance of multiyear models. Furthermore, because drought occurrence at different stages of the rice growth cycle has different impacts on yields, it is also important to understand why NDVIA and SWIA exhibit different temporal patterns in identifying drought moments throughout the growing season. There are also challenges with using farmer-reported data on droughts, especially since the survey data were collected in 2025, potentially introducing recall bias in farmers' estimates of their rice yields and the impacts of past droughts dating back to 2019. This can be seen in the mismatch between drought as identified by SPI/SPEI patterns and farmer-reported drought dekads. Another limitation to this study was a spatial resolution mismatch between EO indices (1 km resolution), and farmer plots (which were rarely larger than one hectare), resulting in an EO signal that comes from more than just rice fields, and may include forests, arid regions, and urban areas. The two meteorological indices are also available at a much lower spatial resolution (approx. 28 km), which is a limitation for accurately matching the complexity between precipitation/evapotranspiration trends and their impacts on vegetation greenness and soil moisture. These spatial resolution mismatches are further complicated by the heterogeneity of smallholder farmer plots in much of sub-Saharan Africa. However, the lower spatial resolution is more relevant for drought monitoring at the landscape level and allows for some disregard of the impacts of management practices or field-level differences. The regression analyses between observations at both landscape and field scales thus also account for soil moisture or vegetation greenness in other land cover types, in addition to rainfed rice fields. This may have affected model performance, especially in years when farmer-reported rice yields did not align with broader landscape-level patterns. The use of linear regression models may also have limited the accuracy of the results, as in some years it is possible that the anomaly-yield change relationship was non-linear or too complex to be explained purely by anomaly variable statistics. Previous studies have identified better relationships between indices such as NDVI and rice crop yields using more complex models (Zhang et al., 2019).
Future research can help unpack these questions, while implementing anomaly-based drought indices in existing EWS can help assess their effectiveness in providing rice farmers with accurate and timely warnings, especially if anomaly indicators are integrated with seasonal forecasting approaches to deliver early drought predictions (De Vos et al., 2025). Future research could also investigate further the influence of rice variety selection for drought resilience of farmers in the region, as differences in growth duration, yields, and tolerance to water insecurity can have large impacts on farmers' economic outcomes (Kim et al., 2017; Omoare and Oyediran, 2020; Sanusi and Dries, 2025). The temporal patterns and correlations between EO indicator anomalies at different phenological stages and rice yields suggest that these indicators could be effective indices for monitoring how drought timing will affect farmers, although more research is needed to understand how regional differences affect yield model performance. Integrating yield modelling to understand the yield impacts of agricultural droughts could be a powerful next step for NiMet, allowing for more specific predictions of crop-level drought impacts. Using only NDVI and SWI in this study did not allow us to account for the utility of other EO indicators, such as Land Surface Temperature, which have been used to monitor drought impacts in past studies (Bayissa et al., 2019; Henchiri et al., 2020) and may be relevant for any follow-up research. Additional thermal data sources such as ECOSTRESS and novel indicators such as the Cooling Efficiency Factor Index (CEFI) also offer promising avenues for future research that could expand this framework to also monitor thermal anomalies (Wu et al., 2022; Zampieri et al., 2025). Additional studies could identify other anomaly indices that may be more discriminative in their identification of agricultural droughts that affect rice yields and investigate how remote sensing products with increased spatial resolution (for example Sentinel-2) could be integrated into this approach to provide analysis of drought impacts on rainfed rice production at the field level.
This study has demonstrated the added value of indices based on vegetation and soil moisture anomalies for monitoring drought impacts on rainfed rice yields in Nigeria and has connected temporal patterns in meteorological variables to farmer-reported yields. The use of field surveys distributed across multiple rice-growing states of Nigeria to train yield models was a unique application and gave relevant insights into how both meteorological and anomaly variables can be used to monitor yield changes due to drought. Although it remains unclear why some discrepancies persist between farmer-reported drought, annual changes in rice yields, and EO indicator-derived drought periods, anomaly indices provide an additional indicator of agricultural droughts with higher spatial resolution than traditional meteorological indices. Zonal clustering maximizes performance around 70 zones but should always be tailored to the specific area of study. Upper threshold values affect the number of drought pixels observed, but a lower threshold increases model specificity. The temporal differences in detected NDVIA/SWIA anomalies suggest that more complex temporal drought patterns are at play, and the discrepancy between non-zero NDVIA/SWIA values and reduced SPI/SPEI values suggests that the anomaly indices provide information on vegetation and soil conditions that are not covered by current standard drought EWS in Nigeria. SWIA is more robust than NDVIA at improving model performance across multiple low-skill years, however optimal effects can be seen where the use of both anomaly indicators improves yield prediction beyond the capacity of meteorological indices alone. Using anomaly indicators calculated at specific phenological stages, rather than over the entire growing season, improves performance, especially for NDVIA, suggesting that monitoring vegetation greenness at these stages can be an effective way to understand drought impacts on crop yields. Despite the need for further research to understand the reasons for interannual instability of using EO anomaly indicators for predicting on-farm rice yields, it is clear that EO anomaly indicators can improve model performance under specific conditions relative to meteorological indices and could be an effective tool for NiMet to improve existing EWS systems. The connection of field survey results to remote sensing anomaly indicators in this study demonstrates the effectiveness of such indicators for identifying agricultural drought impacts on rainfed rice yields in such complex, heterogeneous, and smallholder-dominated landscapes, but additional work could collect field-level data over multiple seasons rather than relying on farmers' recall of past season harvests. Further research and continued efforts to advance EWS employed by NiMet, including the integration of anomaly-based indicators, can ensure that farmers are better informed about the likelihood of upcoming droughts, enabling them to respond or prepare in any possible way. Implementation of the open-source anomaly indicator datasets could be pursued through future projects and through integration of open-source methods developed in this study into existing drought monitoring frameworks.
Table A1Individual communities within local government areas and states where field surveys were conducted during this study.
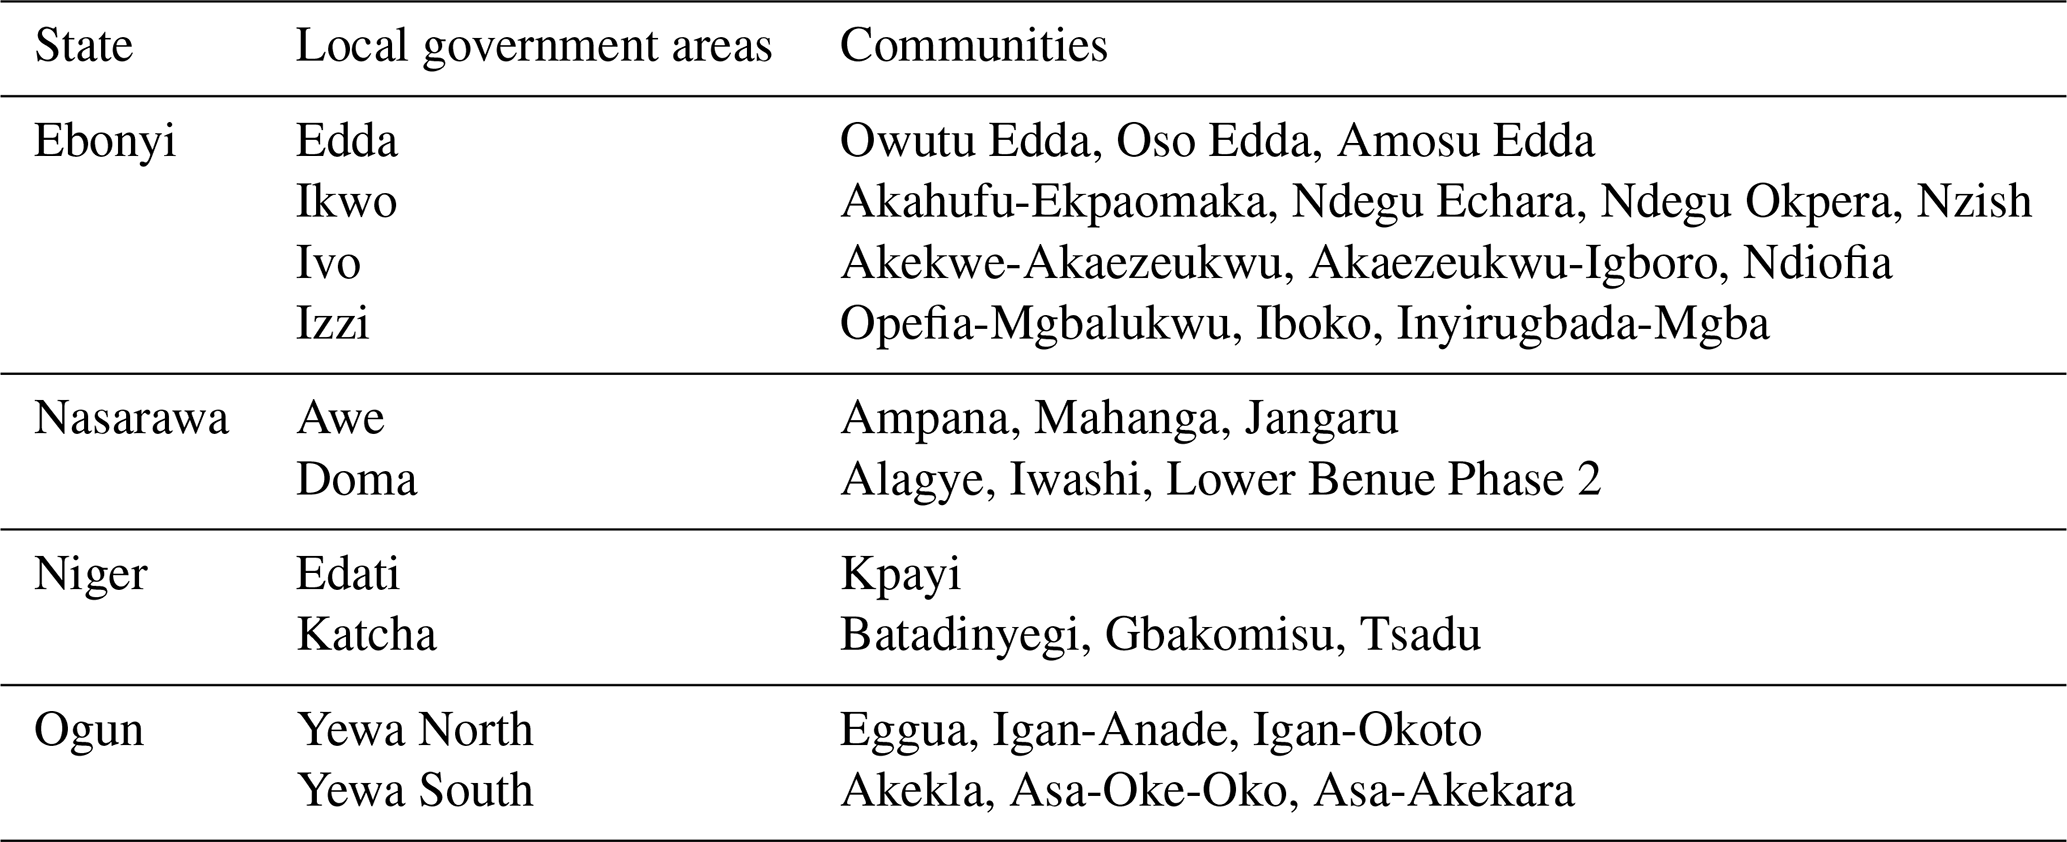
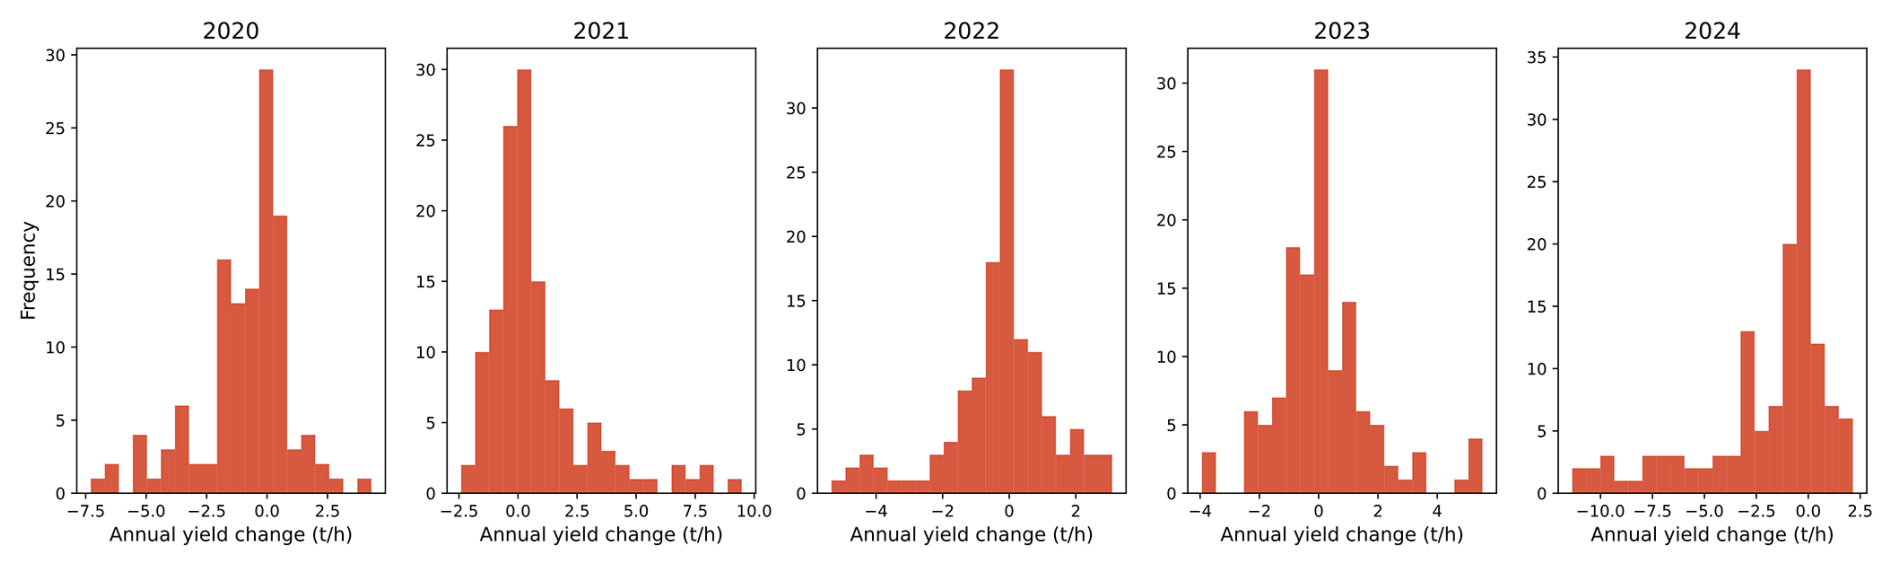
Figure A1Distribution of annual rice yield changes (left to right: 2020, 2021, 2022, 2023, 2024), filtered to remove top and bottom 5 % of observations, used to fit multivariate regression models in this study. Yield change values were derived from farmer surveys collected in the field.
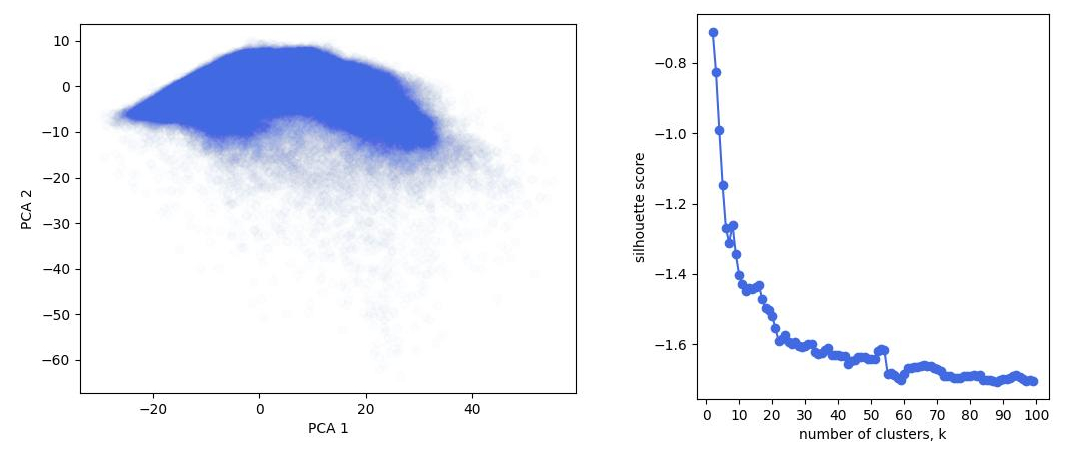
Figure A2Analysis into ideal number of clusters for Kmeans clustering algorithm showing gradient pattern between first two principal components (left) and continuously decreasing gradient of silhouette scores for 10 % pixel sample (right).
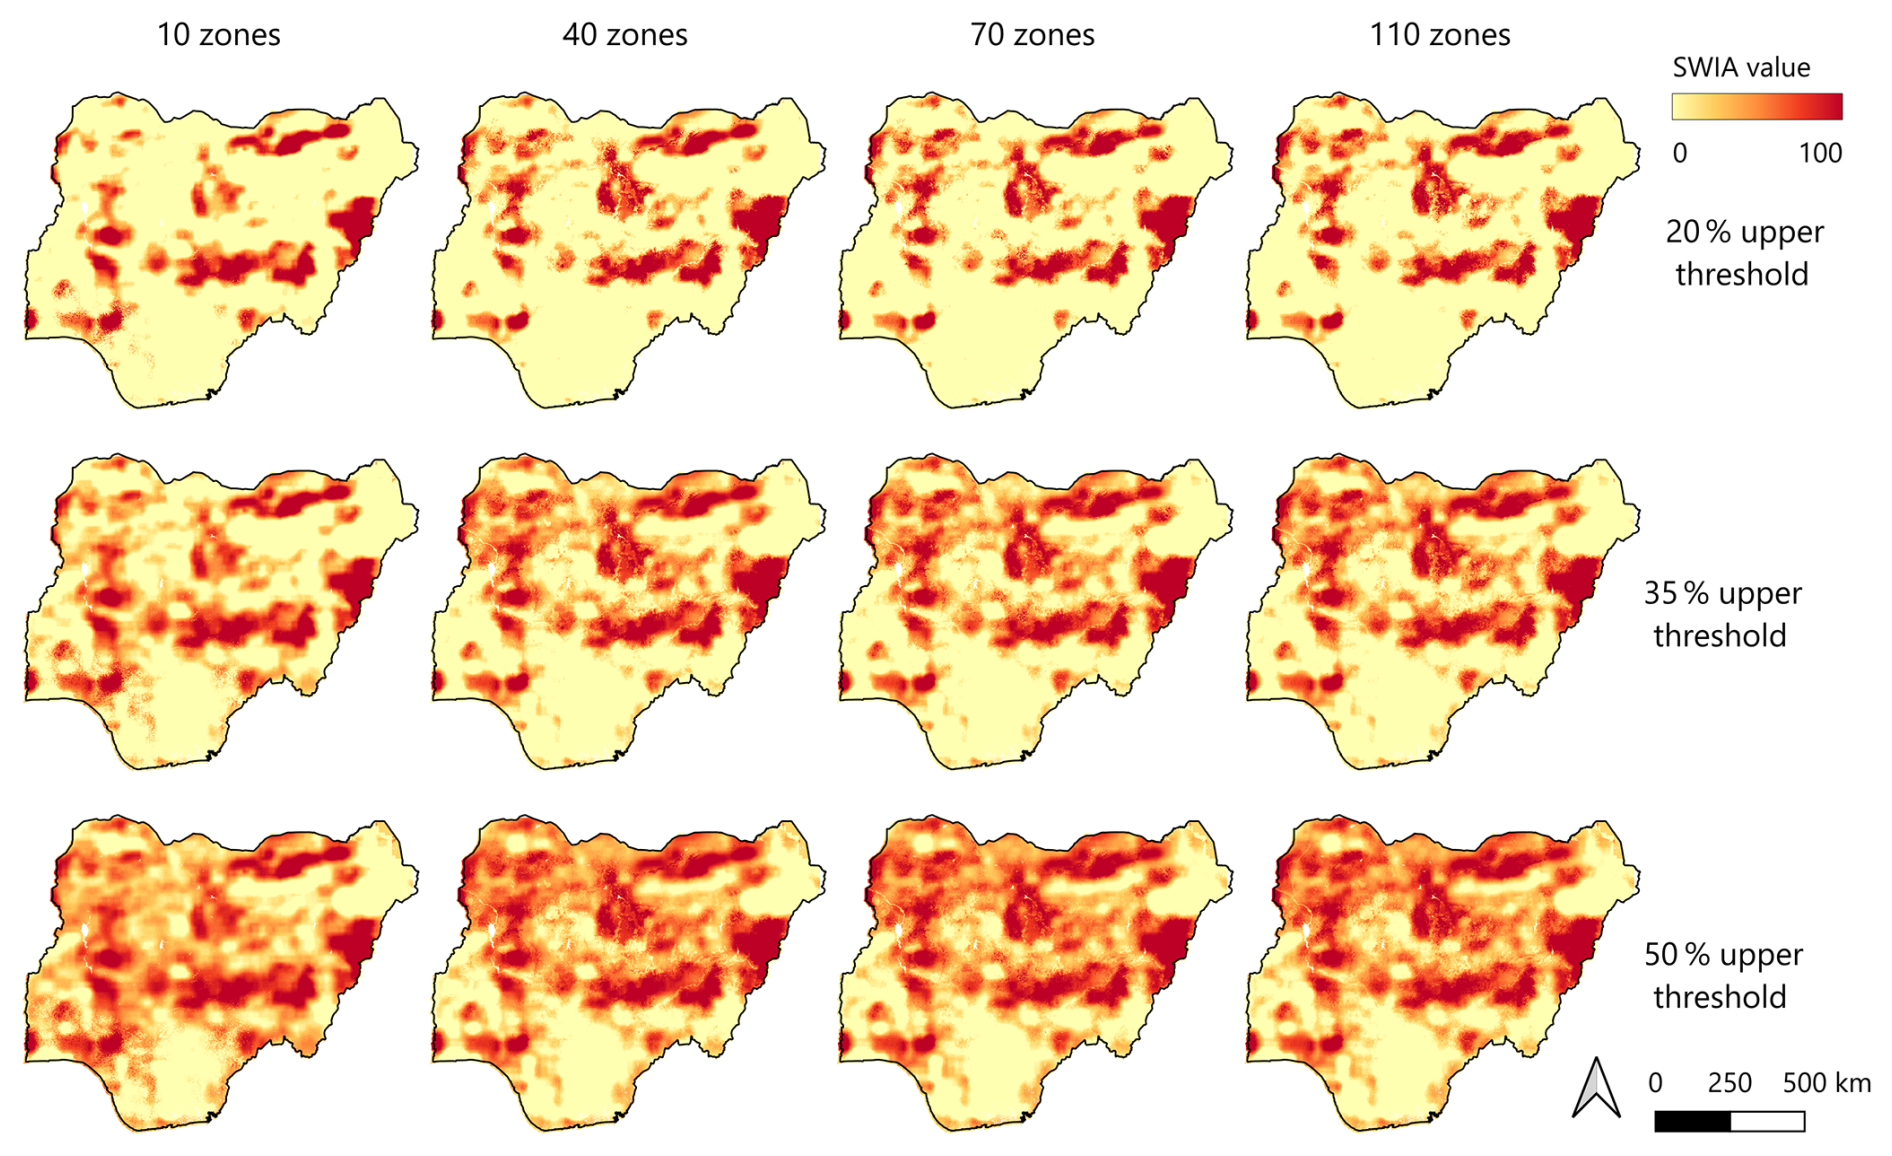
Figure A3SWIA values for different combinations of zones and upper threshold values capturing anomalies in soil moisture during the dekad 11 August 2020.
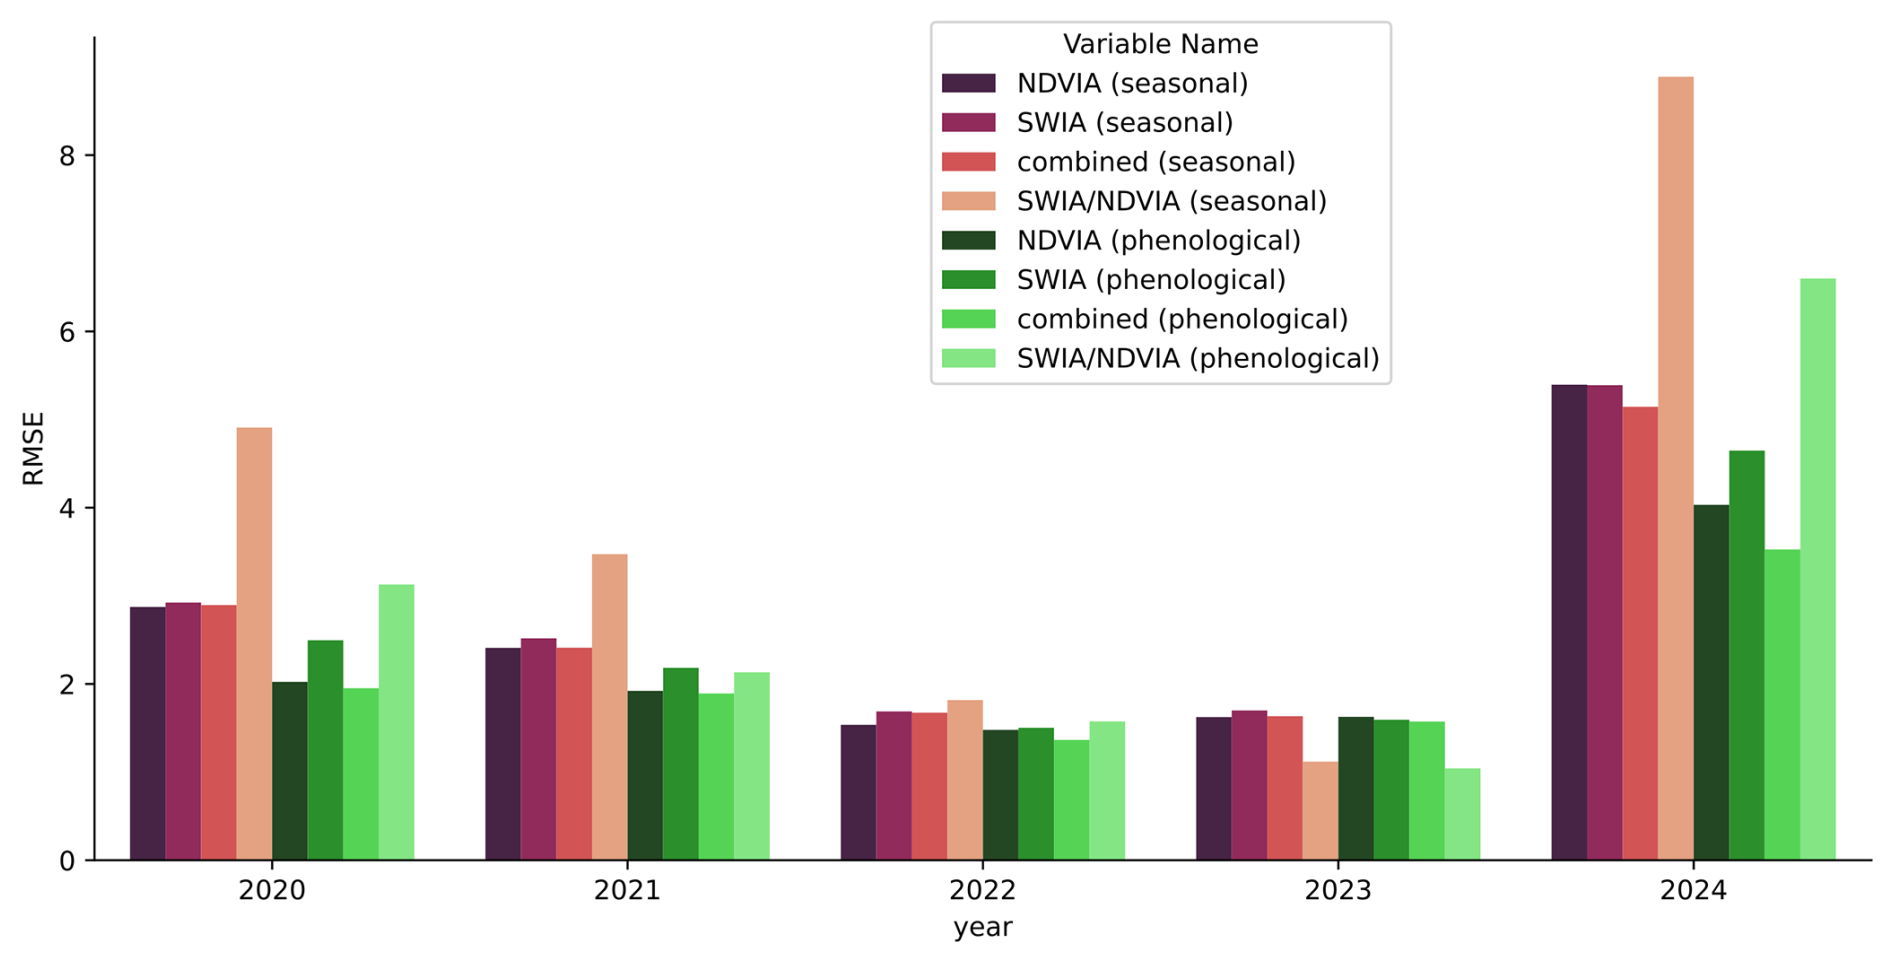
Figure A4Mean RMSE (t ha−1) values for multivariate regression models using NDVIA, SWIA, and both as input variables for individual year models.
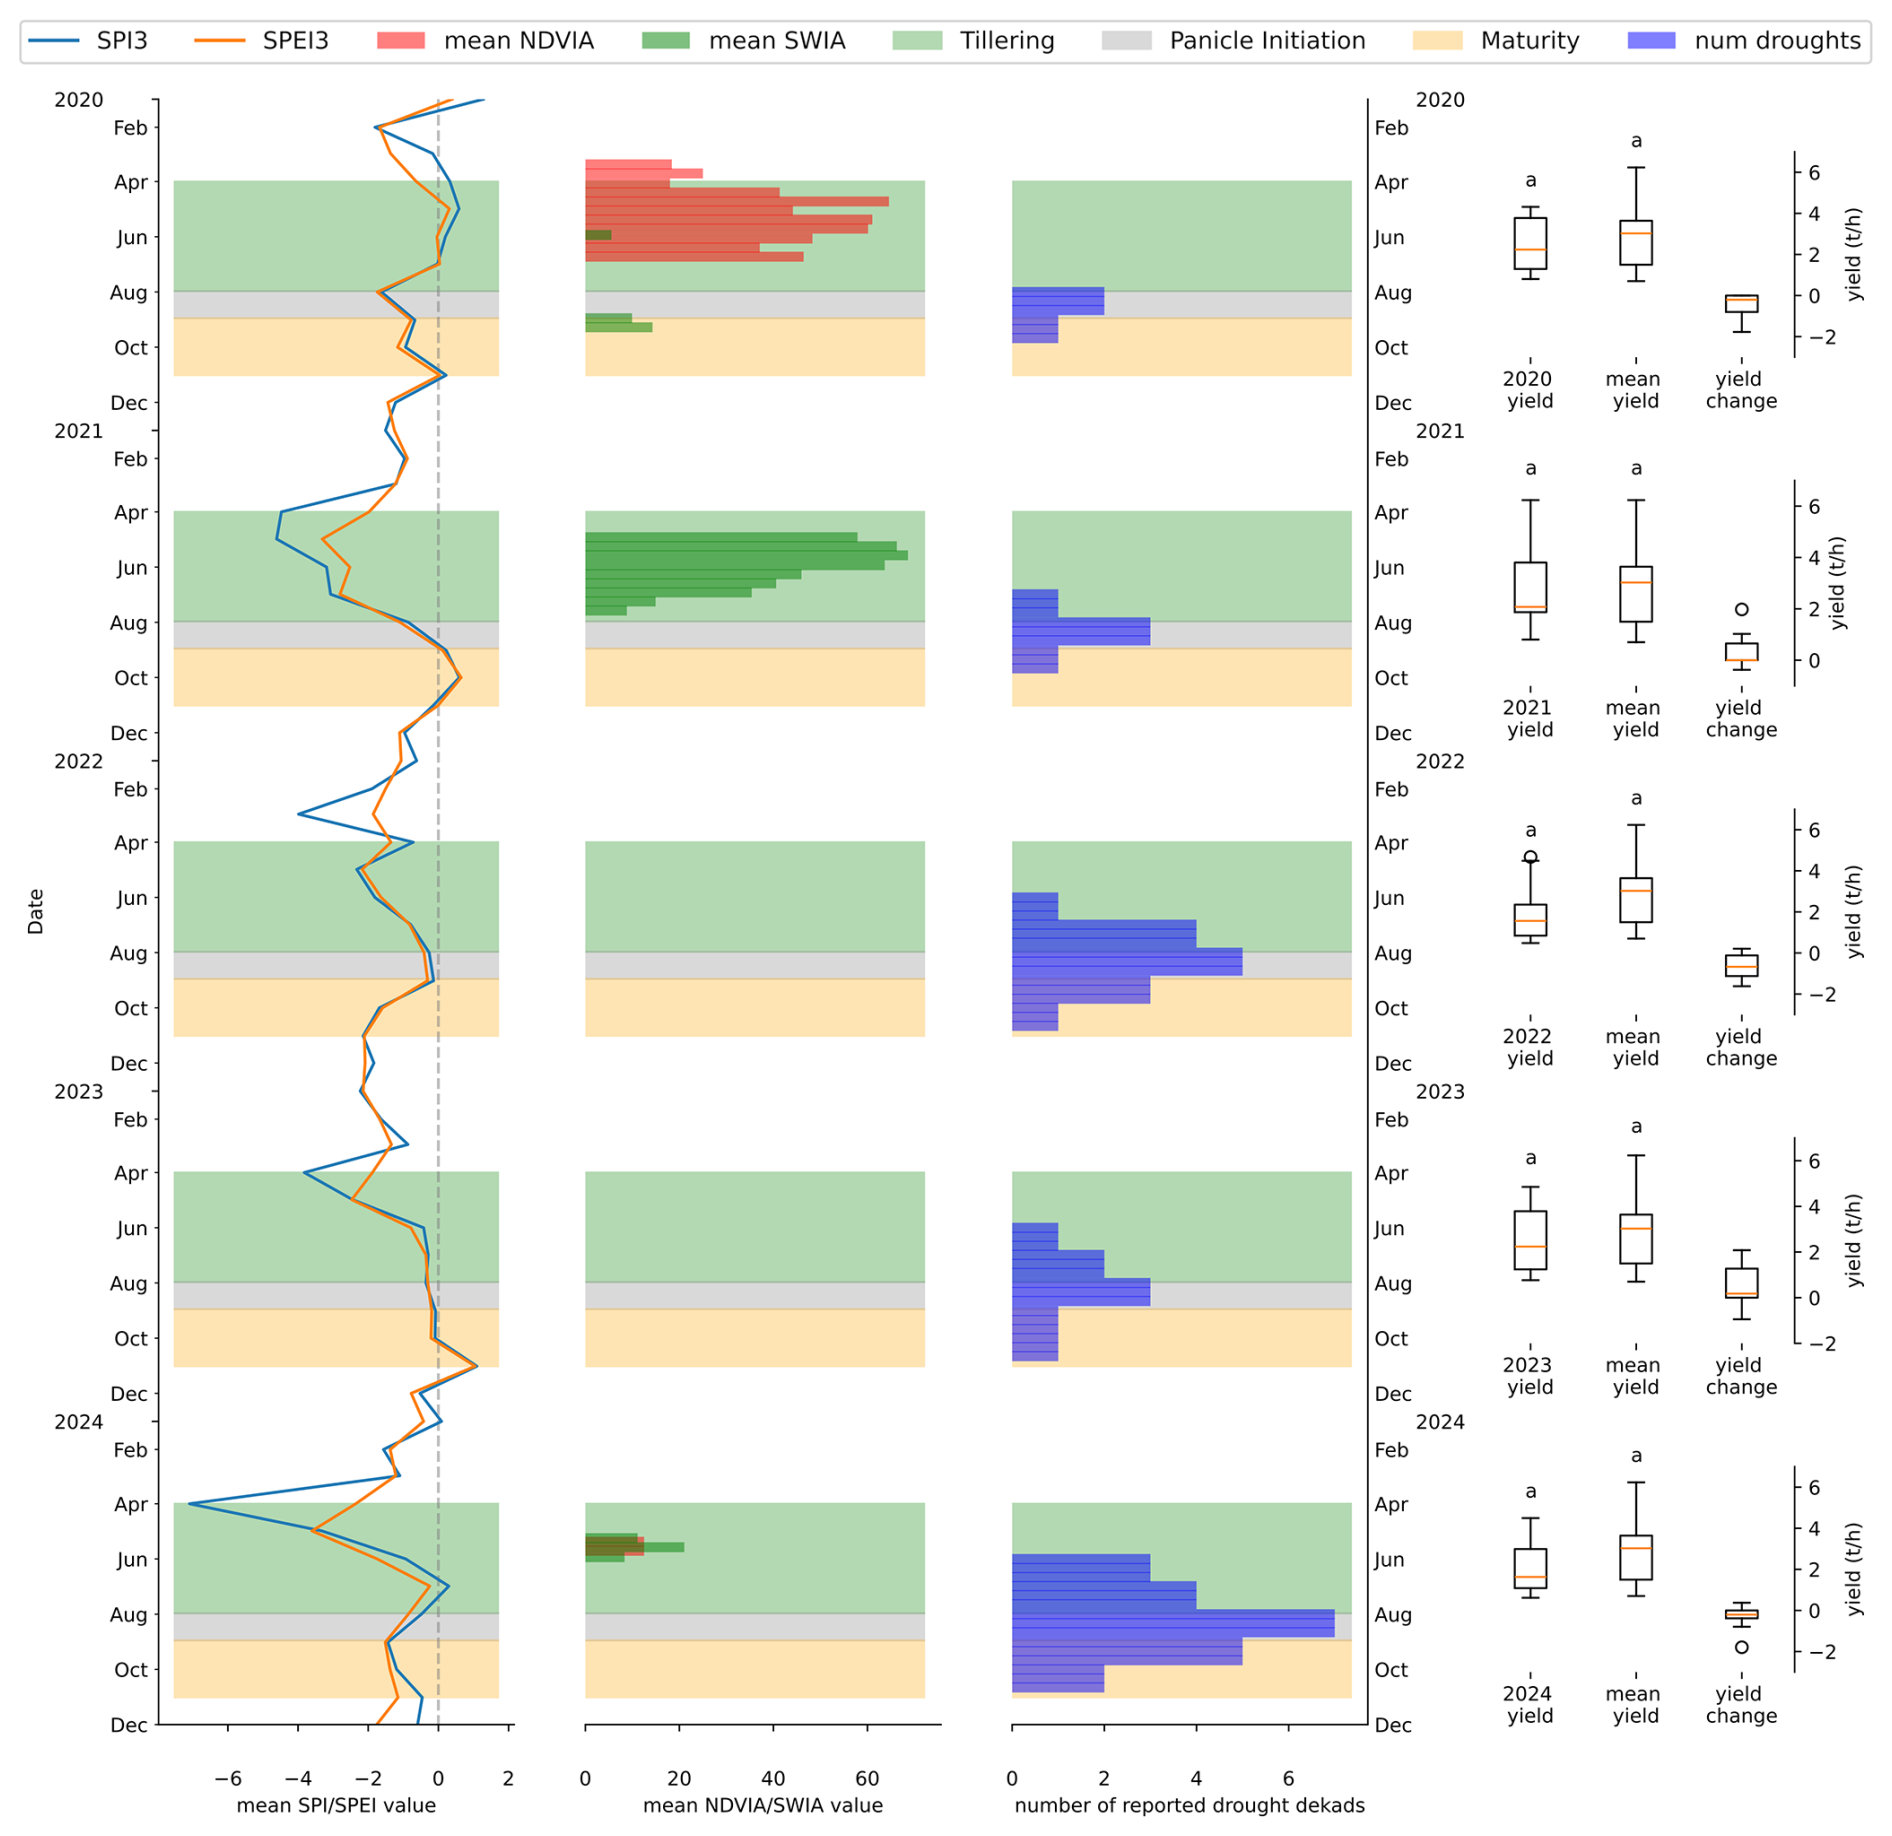
Figure A5Summary graph comparing meteorological variables (SPI3, SPEI3; left), anomaly variables (NDVIA, SWIA; centre left), farmer-reported drought periods (centre-right), and annual/5-year mean yields (right) for Ebonyi state. Anomaly variable values are derived from 70 zone and 20 % upper threshold equation parameters. State-specific rice growth calendar shows different stages of rice development according to field survey results: vegetative growth/tillering (green), panicle initiation (grey), and flowering/grain-filling (yellow). Statistically significant difference (Student's t-test, p < 0.05) between annual and 5-year mean yields is shown via letters (a, b) above boxplots.
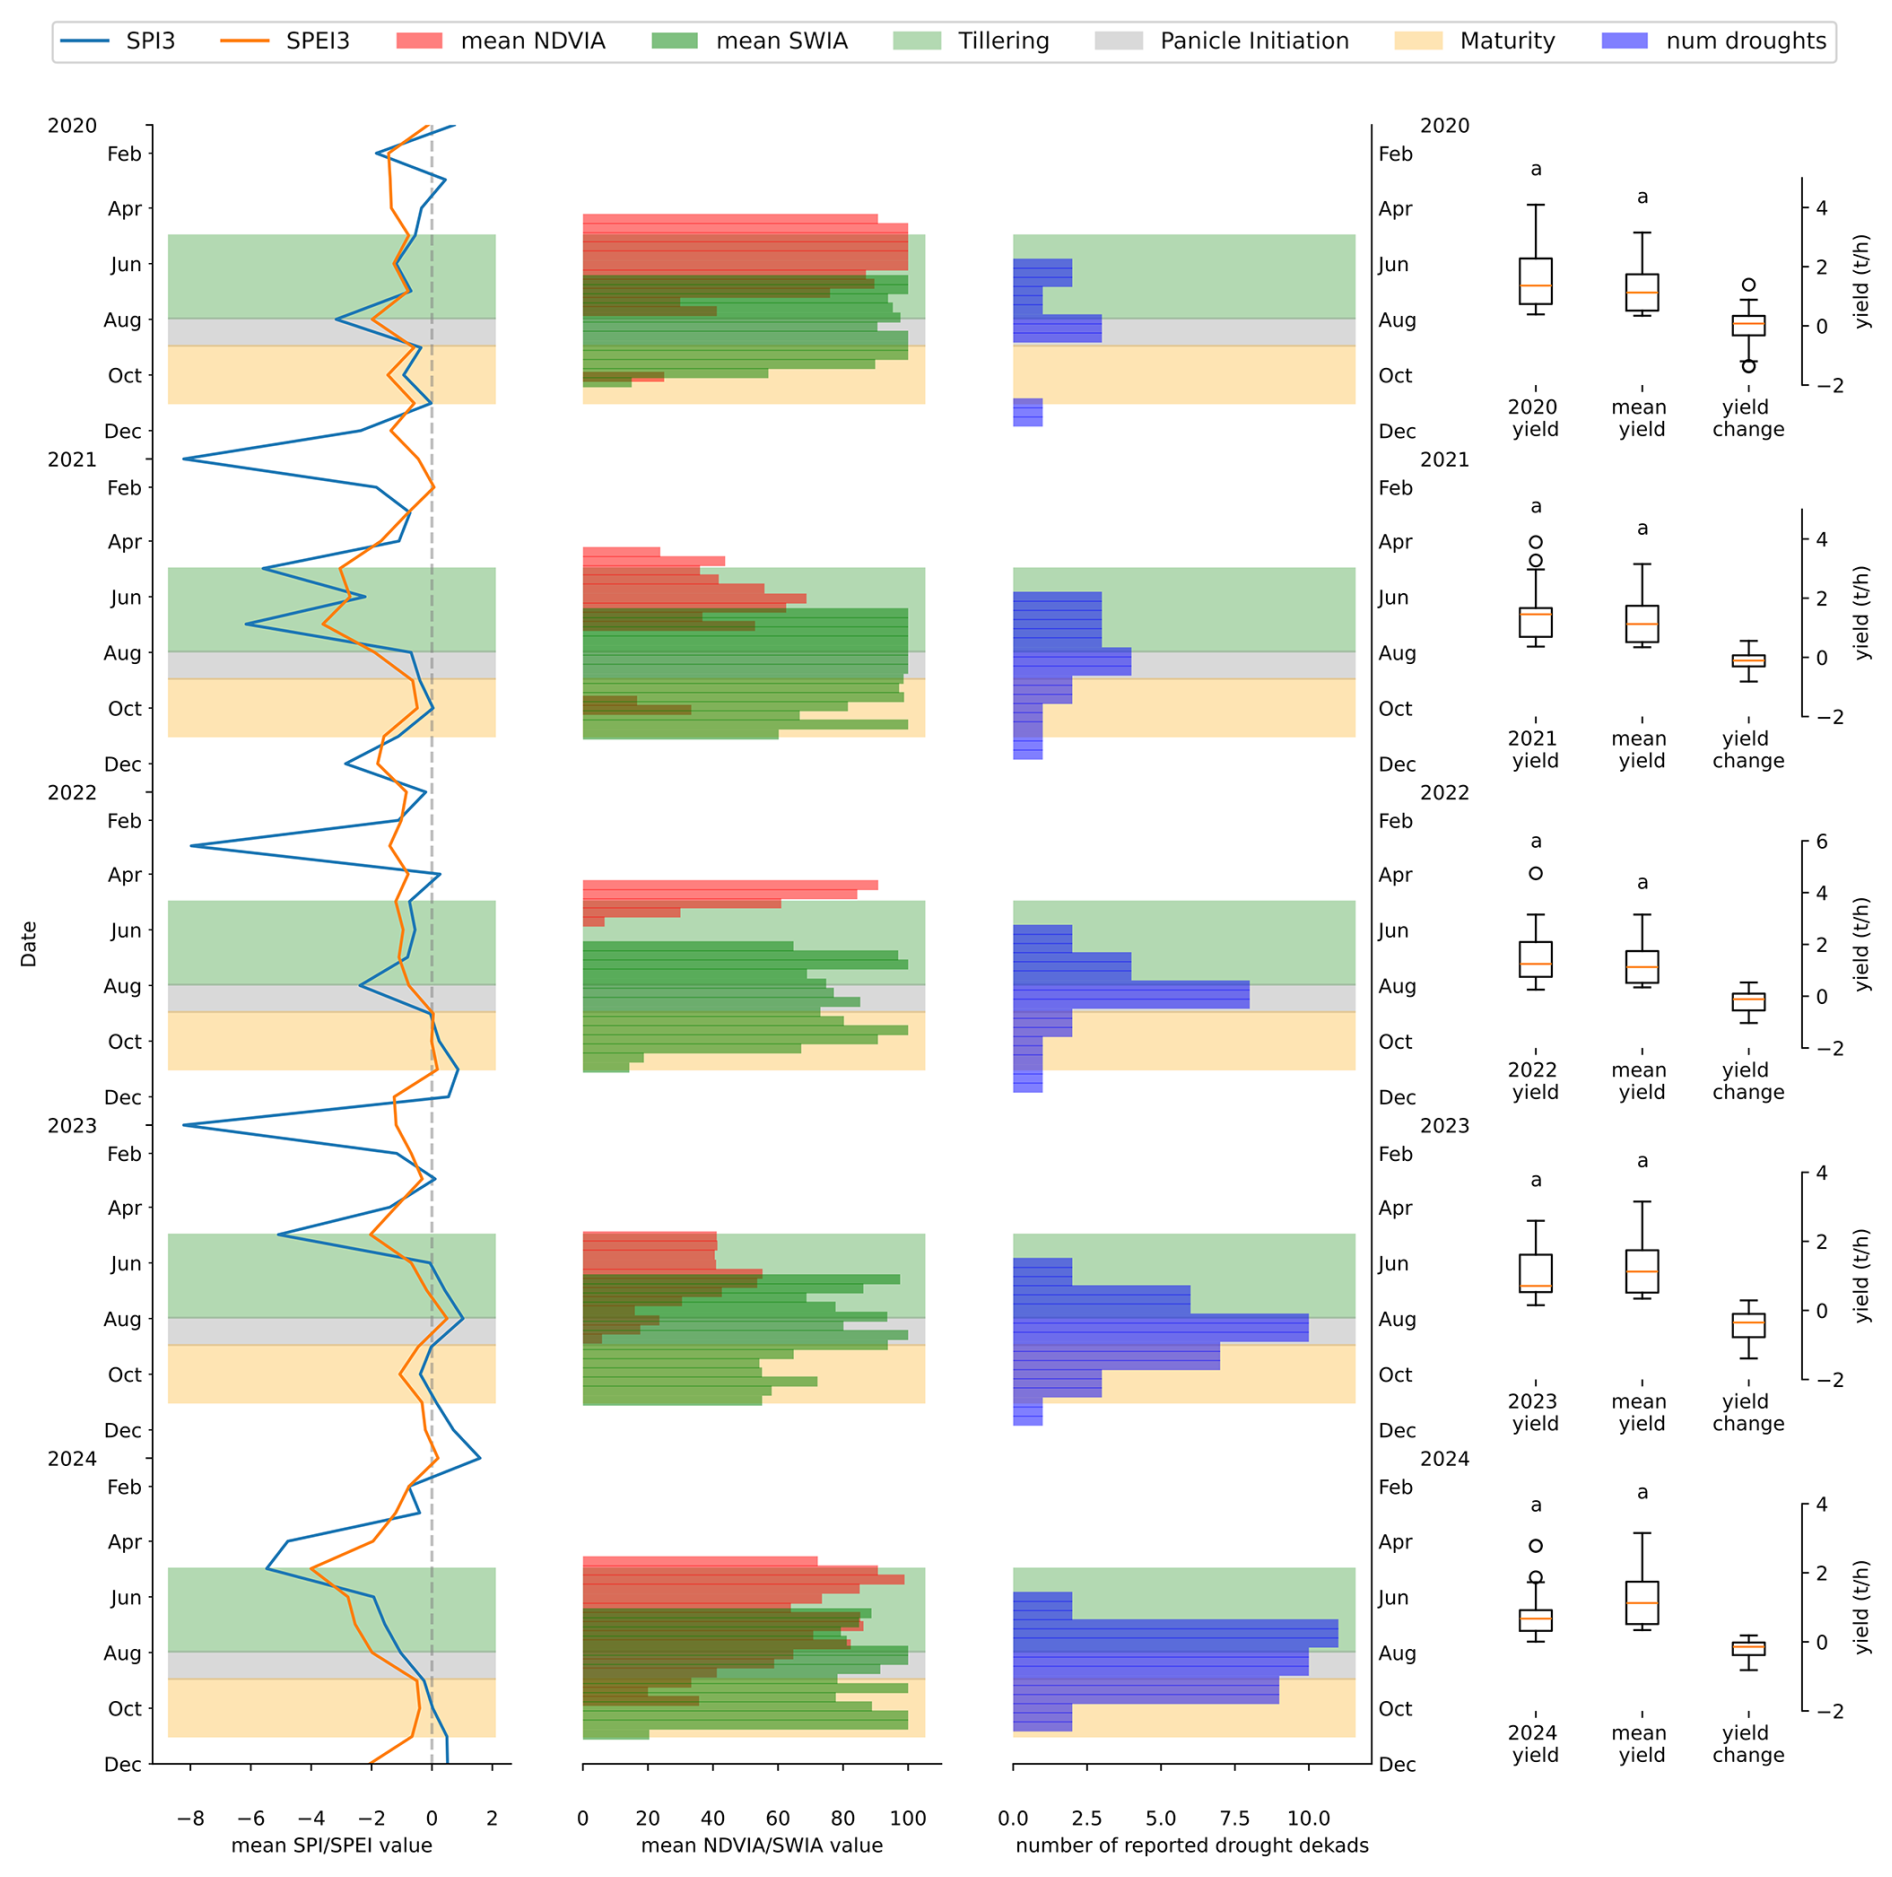
Figure A6Summary graph comparing meteorological variables (SPI3, SPEI3; left), anomaly variables (NDVIA, SWIA; centre left), farmer-reported drought periods (centre-right), and annual/5-year mean yields (right) for Ebonyi state. Anomaly variable values are derived from 70 zone and 20 % upper threshold equation parameters. State-specific rice growth calendar shows different stages of rice development according to field survey results: vegetative growth/tillering (green), panicle initiation (grey), and flowering/grain-filling (yellow). Statistically significant difference (Student's t-test, p < 0.05) between annual and 5-year mean yields is shown via letters (a, b) above boxplots.
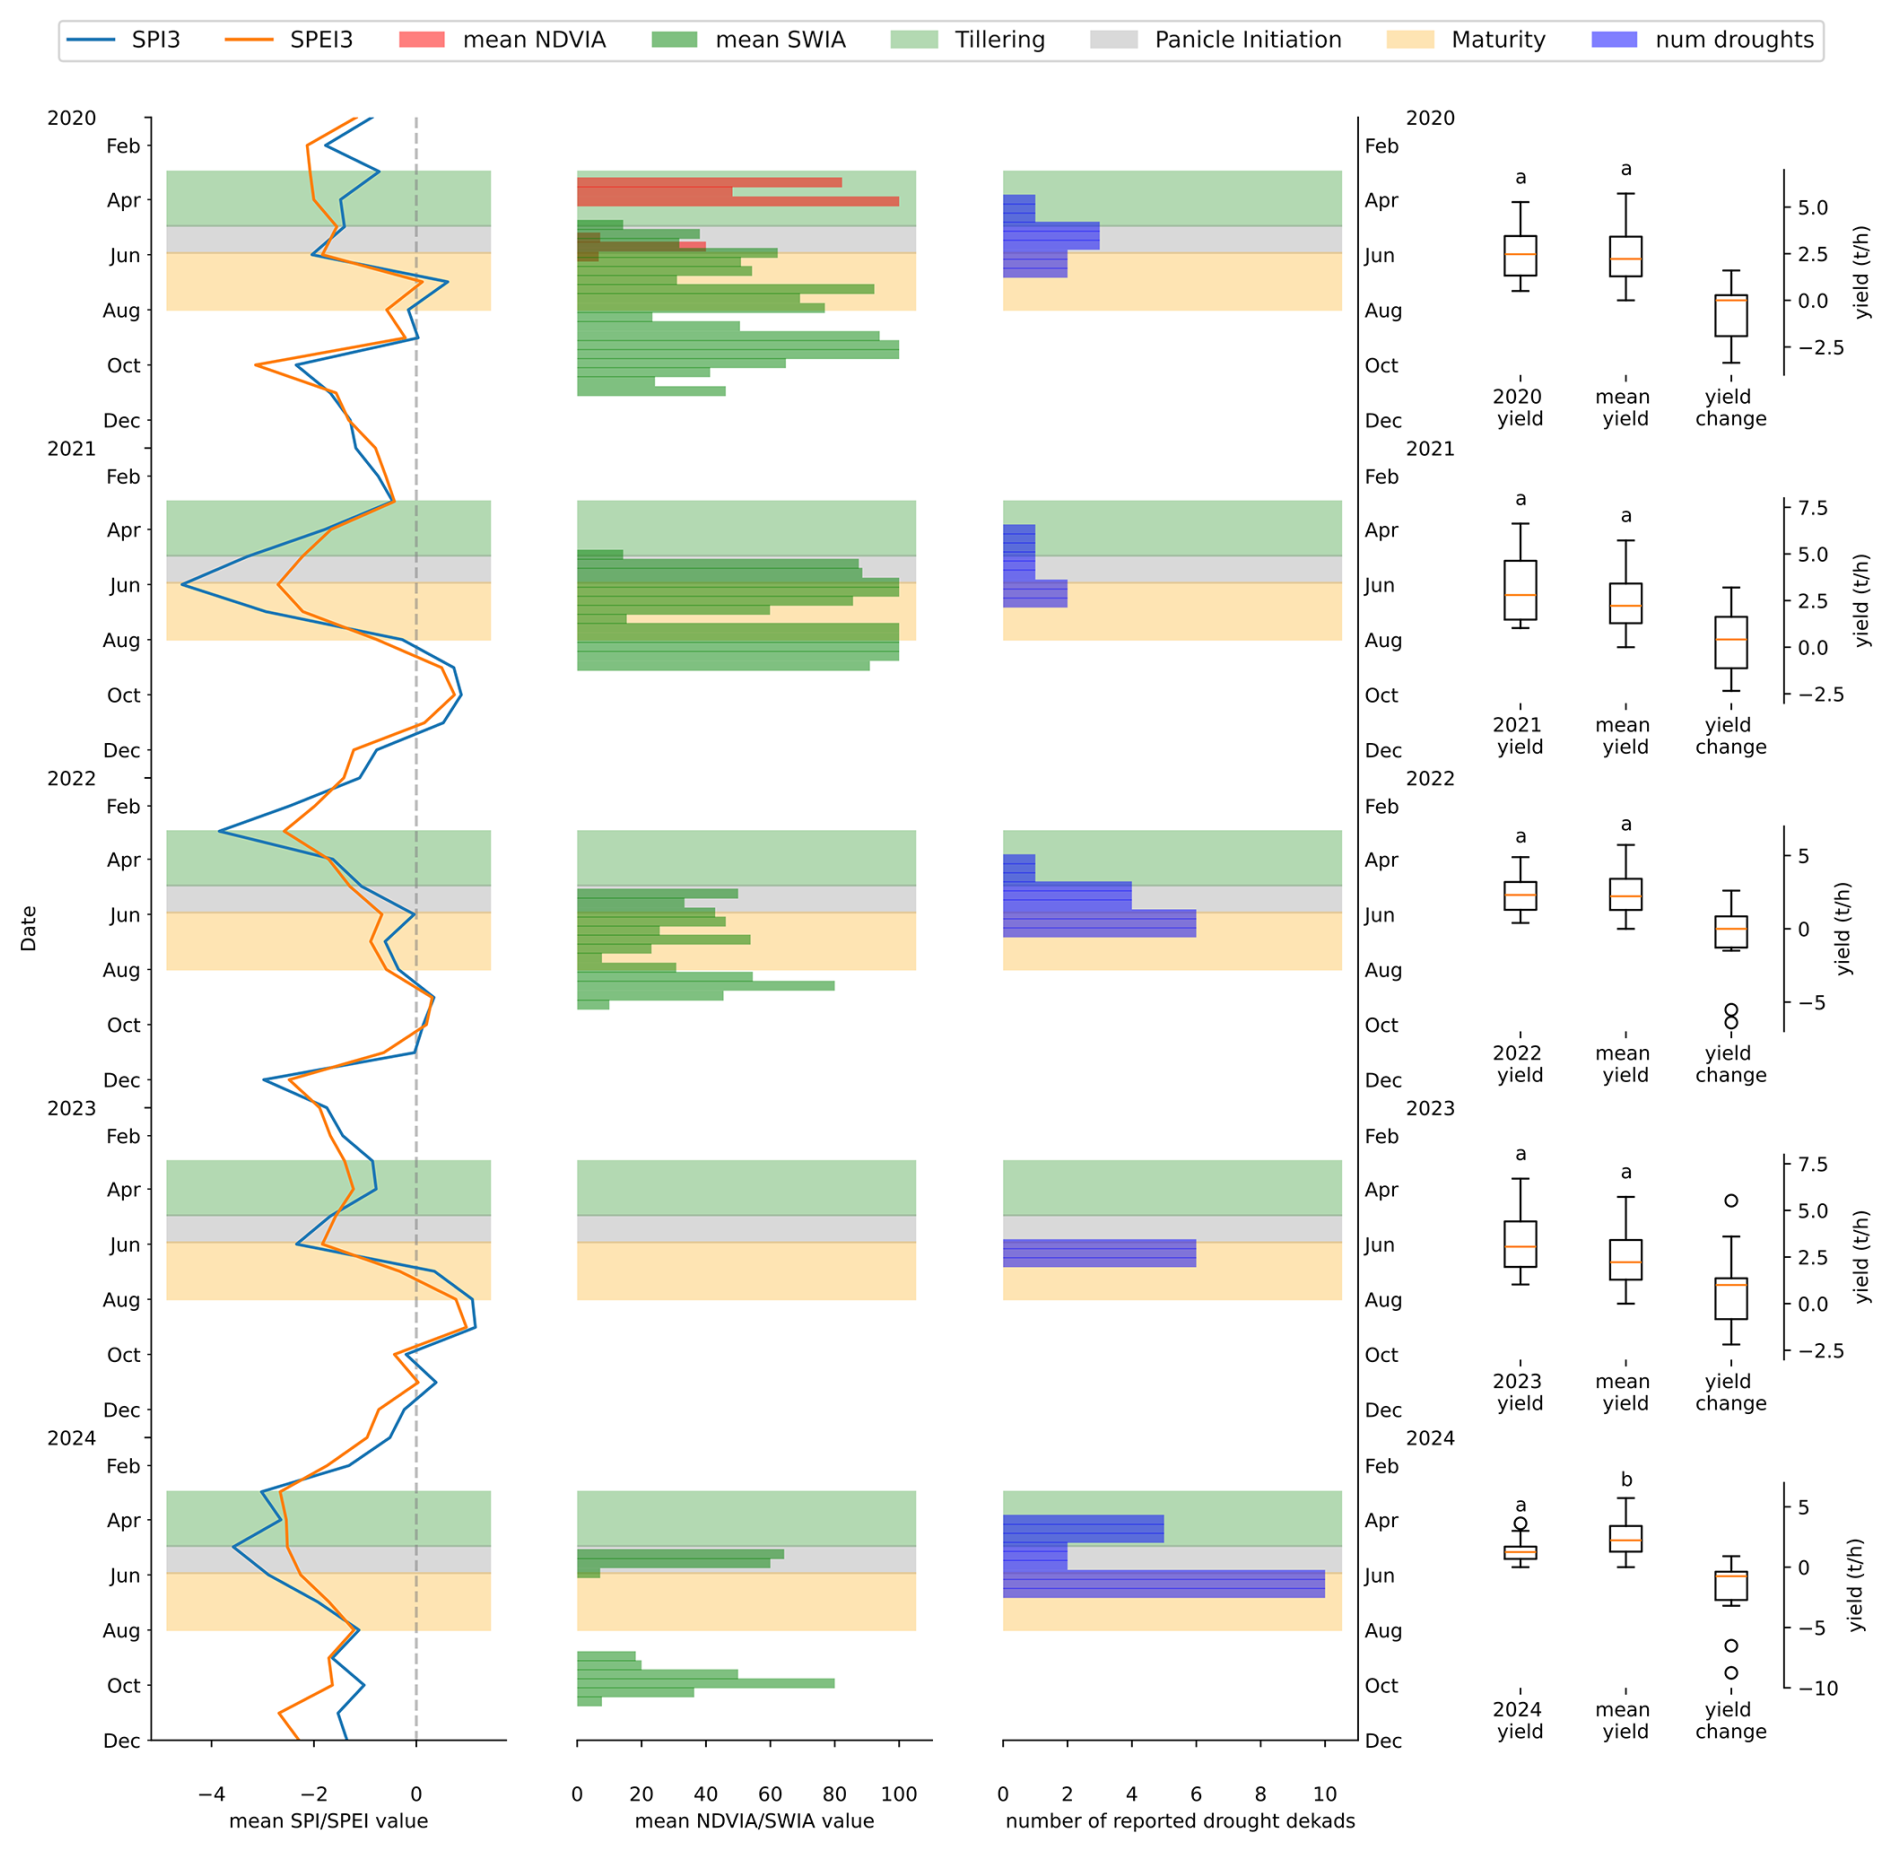
Figure A7Summary graph comparing meteorological variables (SPI3, SPEI3; left), anomaly variables (NDVIA, SWIA; centre left), farmer-reported drought periods (centre-right), and annual/5-year mean yields (right) for Ebonyi state. Anomaly variable values are derived from 70 zone and 20 % upper threshold equation parameters. State-specific rice growth calendar shows different stages of rice development according to field survey results: vegetative growth/tillering (green), panicle initiation (grey), and flowering/grain-filling (yellow). Statistically significant difference (Student's t-test, p < 0.05) between annual and 5-year mean yields is shown via letters (a, b) above boxplots.
All code used to generate data in this research project is available at: https://github.com/gutkinn/MOFODRONI-EO (last access: 3 September 2026; https://doi.org/10.5281/zenodo.22274223, Gutkin, 2026).
EO datasets (including anomaly variables and accuracy metrics) are available at: https://doi.org/10.5281/zenodo.19593937 (Gutkin et al., 2026).
NG: Data curation, formal analysis, funding acquisition, methodology, project administration, visualization, writing (original draft preparation). CIE: Conceptualization, data curation, funding acquisition, investigation, methodology, project administration, writing (review and editing). KDV: Conceptualization, data curation, methodology, software, supervision, writing (review and editing). NE: Data curation, investigation, methodology. JD: Software. SG: Data curation, software. UN: Investigation. AG: Supervision, writing (review and editing).
The contact author has declared that none of the authors has any competing interests.
Publisher's note: Copernicus Publications remains neutral with regard to jurisdictional claims made in the text, published maps, institutional affiliations, or any other geographical representation in this paper. The authors bear the ultimate responsibility for providing appropriate place names. Views expressed in the text are those of the authors and do not necessarily reflect the views of the publisher.
We extend our gratitude to the rice farmers, farming cooperatives, and extension officers who provided information, access to farmlands, and support for data collection. We appreciate Ongele Darlington (APO), Ebonyi state value chain development program (IFAD Assisted), Dr. Mohammed Lawal (APO), FGN/IFAD value chain development program (Niger state), and the state coordinators at FGN/(IFAD Assisted)/OGSG – value chain development program (Nasarawa and Ogun States) for coordinating desk officers and rice farmers. We acknowledge the support from the Department of Geoinformatics and Surveying at the University of Nigeria Nsukka.
This work is supported by the EO Africa R&D Facility, a joint initiative of ESA and the African Union Commission, in the context of the bilateral research project 09_MOFODRONI_NG_BE_EOAC3 between UNN (Nigeria) and VITO (Belgium) (ESA Contract No. 4000133905/21/I-EF).
This paper was edited by Nemesio Rodriguez-Fernandez and reviewed by Matteo Zampieri and one anonymous referee.
Adedeji, O., Olusola, A., James, G., Shaba, H. A., Orimoloye, I. R., Singh, S. K., and Adelabu, S.: Early warning systems development for agricultural drought assessment in Nigeria, Environ. Monit. Assess., 192, 798, https://doi.org/10.1007/s10661-020-08730-3, 2020.
Adefisan, E. A. and Abatan, A. A.: Agroclimatic Zonning of Nigeria Based on Rainfall Characteristics and Index of Drought Proneness, Journal of Environment and Earth Science, 5, 115, https://www.iiste.org/Journals/index.php/JEES/article/view/23310/24056 (last access: 30 April 2026), 2015.
Adenle, A. A., Eckert, S., Adedeji, O. I., Ellison, D., and Speranza, C. I.: Human-induced land degradation dominance in the Nigerian Guinea Savannah between 2003 – 2018, Remote Sensing Applications: Society and Environment, 19, 100360, https://doi.org/10.1016/j.rsase.2020.100360, 2020.
Afiukwa, C. A. A., Faluyi, J. O., Atkinson, C. J., Ubi, B. E. U., Igwe, D. O., and Akinwale, R. O.: Screening of some rice varieties and landraces cultivated in Nigeria for drought tolerance based on phenotypic traits and their association with SSR polymorphisms, Afr. J. Agr. Res., 11, 2599–2615, https://doi.org/10.5897/AJAR2016.11239, 2016.
Ajetomobi, J., Abiodun, A., and Hassan, R.: Impacts of climate change on rice agriculture in Nigeria, Tropical and Subtropical Agroecosystems, 14, 613–622, 2011.
Akinyemi, D. F., Ayanlade, O. S., Nwaezeigwe, J. O., and Ayanlade, A.: A Comparison of the Accuracy of Multi-satellite Precipitation Estimation and Ground Meteorological Records Over Southwestern Nigeria, Remote Sens. Earth Syst. Sci., 3, 1–12, https://doi.org/10.1007/s41976-019-00029-3, 2020.
Akpoilih, O. A. and Dada, O. A.: Morphological Response and Yield of Rice Cultivars to Water Deficit Condition at Different Growth Stages on Sandy Loam Soil in Tropical Rainforest, Journal of Agriculture and Sustainability, 18, https://infinitypress.info/index.php/jas/article/view/2279 (last access: 7 April 2026), 2025.
Alagbo, O. O., Akinyemiju, O. A., and Chauhan, B. S.: Weed management in rainfed lowland rice ecology in Nigeria – challenges and opportunities, Weed Technol., 36, 583–591, https://doi.org/10.1017/wet.2022.57, 2022.
Ali, A. M., Thind, H. S., Sharma, S., and Varinderpal-Singh: Prediction of dry direct-seeded rice yields using chlorophyll meter, leaf color chart and GreenSeeker optical sensor in northwestern India, Field Crop. Res., 161, 11–15, https://doi.org/10.1016/j.fcr.2014.03.001, 2014.
Bauer-Marshallinger, B.: Soil Water Index (SWI) Version 3.0, Copernicus Land Monitoring Service [data set], https://doi.org/10.2909/98c5e00e-3580-4bb3-9509-50a572b1e935, 2018.
Bayissa, Y. A., Tadesse, T., Svoboda, M., Wardlow, B., Poulsen, C., Swigart, J., and Van Andel, S. J.: Developing a satellite-based combined drought indicator to monitor agricultural drought: a case study for Ethiopia, GISci. Remote Sens., 56, 718–748, https://doi.org/10.1080/15481603.2018.1552508, 2019.
Boonjung, H. and Fukai, S.: Effects of soil water deficit at different growth stages on rice growth and yield under upland conditions. 2. Phenology, biomass production and yield, Field Crop. Res., 48, 47–55, https://doi.org/10.1016/0378-4290(96)00039-1, 1996.
Boschetti, M., Nutini, F., Brivio, P. A., Bartholomé, E., Stroppiana, D., and Hoscilo, A.: Identification of environmental anomaly hot spots in West Africa from time series of NDVI and rainfall, ISPRS J. Photogramm., 78, 26–40, https://doi.org/10.1016/j.isprsjprs.2013.01.003, 2013.
Cammalleri, C., McCormick, N., Spinoni, J., and Nielsen-Gammon, J. W.: An Analysis of the Lagged Relationship between Anomalies of Precipitation and Soil Moisture and Its Potential Role in Agricultural Drought Early Warning, J. Appl. Meteorol. Clim., 63, 339–350, https://doi.org/10.1175/JAMC-D-23-0077.1, 2024.
Chiaka, J. C., Zhen, L., Yunfeng, H., Xiao, Y., Muhirwa, F., and Lang, T.: Smallholder Farmers Contribution to Food Production in Nigeria, Front. Nutr., 9, https://doi.org/10.3389/fnut.2022.916678, 2022.
De Vos, K., Gebruers, S., Degerickx, J., Iordache, M.-D., Keune, J., Di Giuseppe, F., Vilela Pereira, F., Wouters, H., Swinnen, E., Van Rossum, K., and Tits, L.: Predicting below-average NDVI anomalies for agricultural drought impact forecasting, Remote Sens. Environ., 330, 114980, https://doi.org/10.1016/j.rse.2025.114980, 2025.
Eludoyin, O. M., Adelekan, I. O., Webster, R., and Eludoyin, A. O.: Air temperature, relative humidity, climate regionalization and thermal comfort of Nigeria, Int. J. Climatol., 34, 2000–2018, https://doi.org/10.1002/joc.3817, 2014.
Erenstein, O., Lançon, F., Akande, S. O., Titilola, S. O., Akpokodje, G., and Ogundele, O. O.: Rice production systems in Nigeria: a survey, West African Rice Development Association (WARDA), Abidjan, Côte d'Ivoire, https://www.inter-reseaux.org/wp-content/uploads/pdf_nigeria_rice_production_systems.pdf (last access: 16 March 2026), 2003.
Eze, E., Girma, A., Zenebe, A. A., and Zenebe, G.: Feasible crop insurance indexes for drought risk management in Northern Ethiopia, Int. J. Disast. Risk Re., 47, 101544, https://doi.org/10.1016/j.ijdrr.2020.101544, 2020.
FAO in Nigeria: https://www.fao.org/nigeria/fao-in-nigeria/nigeria-at-a-glance/en/, last access: 27 February 2026.
Federal Ministry of Environment: National Drought Plan, Federal Ministry of Environment, https://www.unccd.int/sites/default/files/country_profile_documents/1%2520FINAL_NDP_Nigeria.pdf (last access: 28 April 2026), 2018.
FORMECU: The Assessment of Vegetation and Landuse Changes in Nigeria, FORMECU, Abuja, Nigeria, WorldBank, report no. 77994, https://documents.worldbank.org/en/publication/documents-reports/documentdetail/611631468291342228 (last access: 28 April 2026), 1998.
Gommes, R., Wu, B., Zhang, N., Feng, X., Zeng, H., Li, Z., and Chen, B.: CropWatch agroclimatic indicators (CWAIs) for weather impact assessment on global agriculture, Int. J. Biometeorol., 61, 199–215, https://doi.org/10.1007/s00484-016-1199-7, 2017.
Guo, X., Zhang, Z., Zhang, X., Bi, M., and Das, P.: Landscape vulnerability assessment driven by drought and precipitation anomalies in sub-Saharan Africa, Environ. Res. Lett., 18, 064035, https://doi.org/10.1088/1748-9326/acd866, 2023.
Guo, X., Zhang, Z., Zhang, X., and Feng, S.: The inclusion of time-lag response reveals contrasting effects of meteorological and agricultural drought on agroecosystem water use efficiency in Africa, J. Hydrol., 664, 134346, https://doi.org/10.1016/j.jhydrol.2025.134346, 2026.
Gutkin, N.: gutkinn/MOFODRONI-EO: Release for publishing (Version v1.0), Zenodo [code], https://doi.org/10.5281/zenodo.22274223, 2026.
Gutkin, N., Ehiemere, C. I., De Vos, K., Ehiemere, N., Degerickx, J., and Gebruers, S.: MOFODRONI dataset, Earth Observation, Zenodo [data set], https://doi.org/10.5281/zenodo.19593937, 2026.
Gyimah-Brempong, K., Johnson, M., and Takeshima, H.: The Nigerian Rice Economy: Policy Options for Transforming Production, Marketing, and Trade, University of Pennsylvania Press, 320 pp., ISBN 9780812248951, 2016.
Hazaymeh, K., Hassan, Q. K., Hazaymeh, K., and Hassan, Q. K.: Remote sensing of agricultural drought monitoring: A state of art review, AIMSES, 3, 604–630, https://doi.org/10.3934/environsci.2016.4.604, 2016.
Henchiri, M., Liu, Q., Essifi, B., Javed, T., Zhang, S., Bai, Y., and Zhang, J.: Spatio-Temporal Patterns of Drought and Impact on Vegetation in North and West Africa Based on Multi-Satellite Data, Remote Sens., 12, 3869, https://doi.org/10.3390/rs12233869, 2020.
Jabbi, F. F., Li, Y., Zhang, T., Bin, W., Hassan, W., and Songcai, Y.: Impacts of Temperature Trends and SPEI on Yields of Major Cereal Crops in the Gambia, Sustainability, 13, 12480, https://doi.org/10.3390/su132212480, 2021.
Jung, M. and Chang, E.: NDVI-based land-cover change detection using harmonic analysis, Int. J. Remote Sens., 36, 1097–1113, https://doi.org/10.1080/01431161.2015.1007252, 2015.
Keune, J., Di Giuseppe, F., Barnard, C., Damasio da Costa, E., and Wetterhall, F.: ERA5–Drought: Global drought indices based on ECMWF reanalysis, Sci. Data, 12, 616, https://doi.org/10.1038/s41597-025-04896-y, 2025.
Kijoji, A. A., Nchimbi-Msolla, S., Kanyeka, Z. L., Serraj, R., and Henry, A.: Linking root traits and grain yield for rainfed rice in sub-Saharan Africa: Response of Oryza sativa × Oryza glaberrima introgression lines under drought, Field Crop. Res., 165, 25–35, https://doi.org/10.1016/j.fcr.2014.03.019, 2014.
Kim, I., Elisha, I., Lawrence, E., and Moses, M.: Farmers Adaptation Strategies to the Effect of Climate Variation on Rice Production: Insight from Benue State, Nigeria, Environment and Ecology Research, 5, 289–301, https://doi.org/10.13189/eer.2017.050406, 2017.
Kirchner, E., Benami, E., Hobbs, A., Carter, M. R., and Jin, Z.: Get in the Zone: The Risk-Adjusted Welfare Effects of Data-Driven vs. Administrative Borders for Index Insurance Zones, J. Dev. Econ., 103658, https://doi.org/10.1016/j.jdeveco.2025.103658, 2025.
Kogan, F. N.: Remote sensing of weather impacts on vegetation in non-homogeneous areas, Int. J. Remote Sens., 11, 1405–1419, https://doi.org/10.1080/01431169008955102, 1990.
Kogan, F. N.: Droughts of the Late 1980s in the United States as Derived from NOAA Polar-Orbiting Satellite Data, B. Am. Meteor. Soc., 76, 655–668, https://doi.org/10.1175/1520-0477(1995)076<0655:DOTLIT>2.0.CO;2, 1995.
Lay, U. S., Nwaezeigwe, J. O., and Aaron-Ibrahim, V.: Geospatial Assessment of Rainfall Variability and Drought Occurrences in North-Central Nigeria, in: Extreme Climate Events, Loss and Damage in Africa: Resilience and Adaptation, edited by: Ayanlade, A., Nyasimi, M., and Boyd, E., Springer Nature Switzerland, Cham, 121–145, https://doi.org/10.1007/978-3-032-11678-9_6, 2026.
Liu, X., Zhu, X., Pan, Y., Li, S., Liu, Y., and Ma, Y.: Agricultural drought monitoring: Progress, challenges, and prospects, J. Geogr. Sci., 26, 750–767, https://doi.org/10.1007/s11442-016-1297-9, 2016.
Makuya, V., Tesfuhuney, W., Moeletsi, M. E., and Bello, Z.: Assessing the Impact of Agricultural Drought on Yield over Maize Growing Areas, Free State Province, South Africa, Using the SPI and SPEI, Sustainability, 16, https://doi.org/10.3390/su16114703, 2024.
Masih, I., Maskey, S., Mussá, F. E. F., and Trambauer, P.: A review of droughts on the African continent: a geospatial and long-term perspective, Hydrol. Earth Syst. Sci., 18, 3635–3649, https://doi.org/10.5194/hess-18-3635-2014, 2014.
Mba, C. L., Madu, A. I., Ajaero, C. K., and Obetta, A. E.: Patterns of rice production and yields in south eastern Nigeria, African Journal of Food, Agriculture, Nutrition and Development, 21, 18330–18348, 2021.
Mbah, E. N., Ezeano, C. I., and Saror, S. F.: Analysis of Climate Change Effects among Rice Farmers in Benue State, Nigeria, Current Research in Agricultural Sciences, 3, 7–15, https://doi.org/10.18488/journal.68/2016.3.1/68.1.7.15, 2016.
Medida, S. K., Rani, P. P., Kumar, G. V. S., Sireesha, P. V. G., Kranthi, K. C., Vinusha, V., Sneha, L., Naik, B. S. S. S., Pramanick, B., Brestic, M., Gaber, A., and Hossain, A.: Detection of water deficit conditions in different soils by comparative analysis of standard precipitation index and normalized difference vegetation index, Heliyon, 9, https://doi.org/10.1016/j.heliyon.2023.e15093, 2023.
Mwinjuma, M., Wang, R., Mtupili, M., and Twaha, M.: Comparisons of SPI and SPEI in capturing drought dynamics: A Global assessment across arid and humid regions, Atmos. Res., 329, 108475, https://doi.org/10.1016/j.atmosres.2025.108475, 2026.
NAERLS and FMARD: 2020 Wet Season Agricultural Performace in Nigeria, NAERLS and FMARD, Zaria, Nigeria, https://naerls.gov.ng/wp-content/uploads/2022/11/Agricultural-Performance-Survey-of-2020-Wet-Season-in-Nigeria.pdf (last access: 30 April 2026), 2020.
NAERLS and FMARD: National Report of Wet Season Agricultural Performance in Nigeria, NAERLS and FMARD, Zaria, Nigeria, https://naerls.gov.ng/wp-content/uploads/2022/11/Agricultural-Performance-Survey-of-2021-Wet-Season-in-Nigeria.pdf (last access: 30 April 2026), 2021.
NAERLS and FMARD: Agricultural Performance Survey of 2023 Wet Season in Nigeria, NAERLS and FMARD, Zaria, Nigeria, https://naerls.gov.ng/wp-content/uploads/2025/04/Agricultural-Performance-Survey-of-2023-Wet-Season-in-Nigeria.pdf (last access: 30 April 2026), 2023.
NAERLS and FMARD: Agricultural Performance Survey of 2024 Wet Season in Nigeria, NAERLS and FMARD, Zaria, Nigeria, https://naerls.gov.ng/wp-content/uploads/2025/04/Agricultural-Performance-Survey-of-2024-Wet-Season-in-Nigeria.pdf (last access: 30 April 2026), 2024.
National Bureau of Statistics: Annual Abstract of Statistics, 2019, National Bureau of Statistics, https://www.nigerianstat.gov.ng/elibrary/read/1241069 (last access: 4 May 2026), 2019.
National Bureau of Statistics: Nigeria Flood Impact, Recovery and Mitigation Assessment Report 2022–2023, National Bureau of Statistics, National Emergency Management Agency and United Nations Development Programme, Abuja, Nigeria, https://www.undp.org/sites/g/files/zskgke326/files/2023-12/nigeriafloodimpactrecoverymitigationassessmentreport2023.pdf (last access: 30 April 2026), 2023.
Nigeria – Global yield gap atlas: https://yieldgap.com/pages/main.xhtml?view=country_ssa_rice, last access: 27 February 2026.
Nigerian Meteorological Agency: Hydro Meteorology Bulletin January – March 2025, Nigerian Meteorological Agency, https://nimet.gov.ng/publication_detail?id=65 (last access: 4 May 2026), 2025.
NiMet: July 2023 Climate and Health Bulletin, NiMet, https://nimet.gov.ng/publication_detail?id=7 (last access: 30 April 2026), 2023.
NiMet: State of the Climate in Nigeria, NiMet, https://nimet.gov.ng/publication_detail?id=44 (last access: 30 April 2026), 2024.
Nwalieji, H. U. and Uzuegbunam, C. O.: Effect of Climate Change on Rice Production in Anambra State, Nigeria, Journal of Agricultural Extension, 16, 81–91, https://doi.org/10.4314/jae.v16i2.7, 2012.
Odongo, R. A., De Moel, H., and Van Loon, A. F.: Propagation from meteorological to hydrological drought in the Horn of Africa using both standardized and threshold-based indices, Nat. Hazards Earth Syst. Sci., 23, 2365–2386, https://doi.org/10.5194/nhess-23-2365-2023, 2023.
Ofuoku, A. and Obıazı, C.: Constraints to Access and Utilization of Meteorological Services in Delta State, Nigeria, Yuzuncu Il Univ. J. Agric. Sci., 31, 150–161, https://doi.org/10.29133/yyutbd.738294, 2021.
Ogunrinde, A. T., Oguntunde, P. G., Akinwumiju, A. S., and Fasinmirin, J. T.: Analysis of recent changes in rainfall and drought indices in Nigeria, 1981–2015, Hydrol. Sci. J., 64, 17551768, https://doi.org/10.1080/02626667.2019.1673396, 2019.
Ogunrinde, A. T., Enaboifo, M. A., Olotu, Y., Pham, Q. B., and Tayo, A. B.: Characterization of drought using four drought indices under climate change in the Sahel region of Nigeria: 1981–2015, Theor. Appl. Climatol., 143, 843–860, https://doi.org/10.1007/s00704-020-03453-4, 2021.
Ogunrinde, A. T., Oguntunde, P. G., Akinwumiju, A. S., Fasinmirin, J. T., Olasehinde, D. A., Pham, Q. B., Linh, N. T. T., and Anh, D. T.: Impact of Climate Change and Drought Attributes in Nigeria, Atmosphere, 13, 1874, https://doi.org/10.3390/atmos13111874, 2022.
Ojo, T. O., Ogundeji, A. A., and Emenike, C. U.: Does Adoption of Climate Change Adaptation Strategy Improve Food Security? A Case of Rice Farmers in Ogun State, Nigeria, Land, 11, 1875, https://doi.org/10.3390/land11111875, 2022.
Okpara, J. N., Afiesimama, E. A., Anuforom, A. C., Owino, A., and Ogunjobi, K. O.: The applicability of Standardized Precipitation Index: drought characterization for early warning system and weather index insurance in West Africa, Nat. Hazards, 89, 555–583, https://doi.org/10.1007/s11069-017-2980-6, 2017.
Olaniyan, E. A., Cafaro, C., Ogungbenro, S. B., Gbode, I. E., Ajayi, V. O., Oluleye, A., Adefisan, E. A., Schwendike, J., and Lawal, K. A.: Performance evaluation of a high resolution regional model over West Africa for operational use: A case study of August 2017, Meteorol. Appl., 29, e2080, https://doi.org/10.1002/met.2080, 2022.
Oloyede, A., Ozuomba, S., Asuquo, P., Olatomiwa, L., and Longe, O. M.: Data-driven techniques for temperature data prediction: big data analytics approach, Environ. Monit. Assess., 195, 343, https://doi.org/10.1007/s10661-023-10961-z, 2023.
Omoare, A. M. and Oyediran, W. O.: Factors Affecting Rice Farming Practices among Farmers in Ogun and Niger States, Nigeria, Journal of Agricultural Extension, 24, 92–103, https://doi.org/10.4314/jae.v24i2.10, 2020.
Onafeso, O. D., Akanni, C. O., and Badejo, B. A.: Climate Change Dynamics and Imperatives for Food Security in Nigeria, Indonesian Journal of Geography, 47, 151, https://doi.org/10.22146/ijg.9254, 2016.
Onyejuruwa, A., Hu, Z., Anosike, C., Islam, A. R. M. d. T., and Madhushanka, D.: Assessment of WRF model simulations of extreme rainfall events in West Africa: a comprehensive review, Environ. Monit. Assess., 197, 486, https://doi.org/10.1007/s10661-025-13932-8, 2025.
Onyeneke, R. U.: Does climate change adaptation lead to increased productivity of rice production? Lessons from Ebonyi State, Nigeria, Renew. Agric. Food Syst., 36, 54–68, https://doi.org/10.1017/S1742170519000486, 2021.
Page, Y. L., Vasconcelos, M., Palminha, A., Melo, I. Q., and Pereira, J. M. C.: An operational approach to high resolution agro-ecological zoning in West-Africa, PLOS ONE, 12, e0183737, https://doi.org/10.1371/journal.pone.0183737, 2017.
Paulik, C., Dorigo, W., Wagner, W., and Kidd, R.: Validation of the ASCAT Soil Water Index using in situ data from the International Soil Moisture Network, Int. J. Appl. Earth Obs., 30, 1–8, https://doi.org/10.1016/j.jag.2014.01.007, 2014.
Perera, S., Allali, M., Linstead, E., and El-Askary, H.: Deriving Drought Vulnerability Index using Geographically Weighted Principal Component Analysis (GWPCA) and K-Means Clustering for Nile Basin, in: IGARSS 2022 – 2022 IEEE International Geoscience and Remote Sensing Symposium, 3187–3190, https://doi.org/10.1109/IGARSS46834.2022.9883425, 2022.
Phyu, P., Islam, M. R., Sta Cruz, P. C., Collard, B. C. Y., and Kato, Y.: Use of NDVI for indirect selection of high yield in tropical rice breeding, Euphytica, 216, 74, https://doi.org/10.1007/s10681-020-02598-7, 2020.
Raml, B. and Bauer-Marshallinger, B.: Copernicus Global Land operations “Vegetation and Energy”, https://land.copernicus.eu/en/technical-library/product-user-manual-soil-water-index-0.1deg/ (last access: 16 March 2026), 2025.
Rigden, A. J., Golden, C., and Huybers, P.: Retrospective Predictions of Rice and Other Crop Production in Madagascar Using Soil Moisture and an NDVI-Based Calendar from 2010–2017, Remote Sens., 14, https://doi.org/10.3390/rs14051223, 2022.
Rojas, O.: Next Generation Agricultural Stress Index System (ASIS) for Agricultural Drought Monitoring, Remote Sens., 13, https://doi.org/10.3390/rs13050959, 2021.
Sanusi, M. M. and Dries, L.: Smallholder rice farmers' resilience to water insecurity in Ogun State Nigeria, Reg. Environ. Change, 25, 30, https://doi.org/10.1007/s10113-025-02364-2, 2025.
Smets, B., Tavares, J. L., Toté, C., and Wolters, E.: Normalized Difference Vegetation Index Collection 1KM Version 3, Copernicus Land Monitoring Service [data set], https://doi.org/10.2909/8048eb1c-8579-45c6-b188-b0a26ef26248, 2020.
States in Nigeria by Ecological Zone: https://nfhl.naerls.gov.ng/index.php?action=faq&cat=1&id=1&artlang=en, last access: 15 April 2026.
Swinnen, E., Toté, C., and Wolfs, D.: Normalized difference vegetation index collection 300M version 2, Copernicus Land Monitoring Service [data set], https://doi.org/10.2909/ae760a70-708e-459a-8eec-6852462a5faf, 2022.
Tefera, M. L., Seddaiu, G., Carletti, A., and Awada H.: Rainfall variability and drought in West Africa: challenges and implications for rainfed agriculture, Theor. Appl. Climatol., 156, 41, https://doi.org/10.1007/s00704-024-05251-8, 2024.
Tian, L., Zhang, B., and Wu, P.: A global drought dataset of standardized moisture anomaly index incorporating snow dynamics (SZIsnow) and its application in identifying large-scale drought events, Earth Syst. Sci. Data, 14, 2259–2278, https://doi.org/10.5194/essd-14-2259-2022, 2022.
Tirivarombo, S., Osupile, D., and Eliasson, P.: Drought monitoring and analysis: Standardised Precipitation Evapotranspiration Index (SPEI) and Standardised Precipitation Index (SPI), Phys. Chem. Earth A/B/C, 106, 1–10, https://doi.org/10.1016/j.pce.2018.07.001, 2018.
Traore, S. B., Ali, A., Tinni, S. H., Samake, M., Garba, I., Maigari, I., Alhassane, A., Samba, A., Diao, M. B., Atta, S., Dieye, P. O., Nacro, H. B., and Bouafou, K. G. M.: AGRHYMET: A drought monitoring and capacity building center in the West Africa Region, Weather and Climate Extremes, 3, 22–30, https://doi.org/10.1016/j.wace.2014.03.008, 2014.
Udemezue, J. C.: Analysis of Rice Production and Consumption Trends in Nigeria, Journal of Plant Sciences and Crop Protection, 1, 1–6, 2018.
van Ginkel, M. and Biradar, C.: Drought Early Warning in Agri-Food Systems, Climate, 9, 134, https://doi.org/10.3390/cli9090134, 2021.
Van Hoolst, R., Eerens, H., Haesen, D., Royer, A., Bydekerke, L., Rojas, O., Li, Y., and Racionzer, P.: FAO's AVHRR-based Agricultural Stress Index System (ASIS) for global drought monitoring, Int. J. Remote Sens., 37, 418–439, https://doi.org/10.1080/01431161.2015.1126378, 2016.
Vos, R., Husain, A., Greb, F., Läderach, P., and Rice, B.: Food crisis risk monitoring: Early warning for early action, in: Global Food Policy Report 2023: Rethinking Food Crisis Responses, Chap. 2, 20–35, https://doi.org/10.2499/9780896294417_02, 2023.
Winkler, K., Gessner, U., and Hochschild, V.: Identifying Droughts Affecting Agriculture in Africa Based on Remote Sensing Time Series between 2000–2016: Rainfall Anomalies and Vegetation Condition in the Context of ENSO, Remote Sens., 9, https://doi.org/10.3390/rs9080831, 2017.
World Meteorological Organization (WMO) and Global Water Partnership (GWP): Handbook of Drought Indicators and Indices, edited by: Svoboda, M. and Fuchs, B. A., Integrated Drought Management Programme (IDMP), Integrated Drought Management Tools and Guidelines Series 2, Geneva, ISBN 978-91-87823-24-4, 2016.
Wu, J., Feng, Y., Liang, L., He, X., and Zeng, Z.: Assessing evapotranspiration observed from ECOSTRESS using flux measurements in agroecosystems, Agr. Water Manage., 269, 107706, https://doi.org/10.1016/j.agwat.2022.107706, 2022.
Zampieri, M., Garcia, G. C., Dentener, F., Gumma, M. K., Salamon, P., Seguini, L., and Toreti, A.: Surface Freshwater Limitation Explains Worst Rice Production Anomaly in India in 2002, Remote Sens., 10, https://doi.org/10.3390/rs10020244, 2018.
Zampieri, M., Piccardo, M., Girardello, M., Ceccherini, G., Hoteit, I., and Cescatti, A.: Remote monitoring of plant drought stress with the apparent heat capacity, Sci. Total Environ., 1000, 180391, https://doi.org/10.1016/j.scitotenv.2025.180391, 2025.
Zhang, K., Ge, X., Shen, P., Li, W., Liu, X., Cao, Q., Zhu, Y., Cao, W., and Tian, Y.: Predicting Rice Grain Yield Based on Dynamic Changes in Vegetation Indexes during Early to Mid-Growth Stages, Remote Sens., 11, https://doi.org/10.3390/rs11040387, 2019.
Zribi, M., Nativel, S., and Page, M. L.: Analysis of Agronomic Drought in a Highly Anthropogenic Context Based on Satellite Monitoring of Vegetation and Soil Moisture, Remote Sens., 13, https://doi.org/10.3390/rs13142698, 2021.