
the Creative Commons Attribution 4.0 License.
the Creative Commons Attribution 4.0 License.
 | 29 Jul 2026
Inferring effective firn grain size across Antarctic ice shelves from ASCAT observations

Bert Wouters
Sanne Veldhuijsen
Sophie de Roda Husman
Weiran Li
Stef Lhermitte
The stability of Antarctic ice shelves is closely linked to the properties of the firn layer, which regulates meltwater retention and influences ice shelf vulnerability to hydrofracturing. Firn Densification Models (FDMs) provide valuable insights into the firn structure, but key properties such as grain size are often parameterized using simple approximations, leading to significant uncertainties, especially in regions lacking in-situ validation. Here, we infer an effective firn grain-size parameter across Antarctic ice shelves, constrained by 15 years (2007–2021) of active microwave observations from the C-band Advanced Scatterometer (ASCAT). Within this framework, we use the Institute for Marine and Atmospheric Research Utrecht Firn Densification Model (IMAU-FDM) to prescribe the state of the firn layer (layer thickness, density, temperature, and liquid water content) and couple it with the Snow Microwave Radiative Transfer (SMRT) model to simulate radar backscatter. Grain size is treated as an unknown microstructural parameter and is optimized by minimizing the misfit between FDM–SMRT simulations and ASCAT observations. The retrieved parameter provides an observationally constrained measure of effective firn microstructure within the adopted FDM–SMRT framework, although independent validation is required before interpreting it as an absolute physical grain-size measurement. The framework is further used to examine how the sensitivity of ASCAT backscatter varies across firn regimes, and how this influences the interpretation of backscatter in terms of firn air content (FAC; the vertically integrated pore-air content of the firn column). Our results show broad consistency between the optimized effective grain size and IMAU-FDM estimates in high-FAC regions, where ASCAT backscatter is most sensitive to interannual variability in grain size. In contrast, larger discrepancies emerge in intermediate- to low-FAC regions, particularly on the Amery Ice Shelf, where ice saturation in the firn (pore-space depletion) influences grain growth. The sensitivity experiments indicate that inversion constraints are regime-dependent, with the strongest sensitivity to grain size in intermediate firn regimes and weaker constraints in strongly depleted firn. Furthermore, by statistically reducing grain-size-driven scatter after inversion, we present a proof of concept for a more interpretable backscatter–FAC relationship, which may support future development and evaluation of FAC-oriented diagnostic retrieval frameworks. These findings provide a basis for improving firn model parameterization and supporting large-scale diagnostic monitoring of firn-state variability across Antarctic ice shelves in a warming climate.
- Article
(5410 KB) - Full-text XML
- BibTeX
- EndNote


Assessing firn properties is crucial for understanding the stability of Antarctic ice shelves, as firn regulates meltwater retention and influences their susceptibility to hydrofracturing (Kuipers Munneke et al., 2014). With climate warming intensifying surface melting, tracking firn evolution is essential for predicting the long-term stability of Antarctic ice shelves (Veldhuijsen et al., 2024). Key firn properties, such as grain size and Firn Air Content (FAC; the vertically integrated pore-air content of the firn column), provide critical insights into firn microstructure and permeability, influencing its ability to store and refreeze meltwater (Kuipers Munneke et al., 2014; Picard et al., 2022b; Amory et al., 2024). In high-FAC firn, fresh snowfall maintains permeability, allowing meltwater to percolate and either refreeze within the firn or be stored internally (Kuipers Munneke et al., 2014). However, sustained melt and densification can deplete pore space, leading to ice-saturated firn conditions in which infiltration is strongly limited, promoting the formation of surface melt ponds that increase the risk of hydrofracturing and ice-shelf destabilization (Scambos et al., 2000).
Spatio-temporal variations in firn properties, specifically grain size and FAC, can be assessed using Firn Densification Models (FDMs) (Veldhuijsen et al., 2024; Medley et al., 2022), field-based methods (Clerx et al., 2022; Xu et al., 2023), and, to some extent, satellite observations (Alley et al., 2018; Scambos et al., 2003). FDMs provide a powerful means to simulate firn structure at high vertical and temporal resolution (Veldhuijsen et al., 2024), enabling reconstructions of FAC evolution over the contemporary Antarctic climate (Veldhuijsen et al., 2024; Medley et al., 2022). However, a critical limitation of FDMs is their simplistic treatment of grain size evolution, which is often parameterized with minimal observational constraints (Veldhuijsen et al., 2024). Although FDMs incorporate firn densification physics, they rely on assumed relationships between grain size and environmental conditions, which are poorly validated in regions with substantial melt-refreezing processes. This gap in model representation limits our ability to assess firn permeability, meltwater retention, and ice shelf vulnerability.
Satellite remote sensing provides a valuable opportunity to assess firn properties at large spatial scales, particularly using microwave observations that penetrate the snowpack and respond to variations in microstructure and therefore also grain size and FAC (Alley et al., 2018; Picard et al., 2022b). Active microwave backscatter from the C-band Advanced Scatterometer (ASCAT) is especially sensitive to firn microstructure and can be leveraged to improve grain size parameterization in FDMs. Previous studies (Alley et al., 2018) have explored ASCAT backscatter as a proxy for hydrofracture potential by examining the relationship between scattering properties and surface mass balance (SMB) components, such as melt season duration and accumulation, to assess firn saturation. Alternatively, Dattler et al. (2024) demonstrated an end-to-end, physics-based workflow from passive microwave observations, snow microwave radiative transfer model (SMRT), and firn modeling, to detect melt in Antarctica, illustrating how SMRT can link microwave signals to firn state. Yet, the potential to directly constrain firn properties in densification models remains largely unexplored. Because grain size modulates the C-band backscatter, variations in grain size can obscure the backscatter–FAC relationship. Any backscatter-based FAC retrieval must therefore first account for grain-size variability.
Building on these earlier studies, we leverage 15 years (2007–2021) of ASCAT backscatter data to constrain an effective firn grain-size parameter across Antarctic ice shelves. By coupling IMAU-FDM with the SMRT model (referred to as FDM-SMRT coupling hereafter), we simulate radar backscatter and iteratively refine grain size estimates to minimize discrepancies with ASCAT observations. Beyond constraining grain size, this framework also allows us to examine how the sensitivity of ASCAT backscatter shifts across firn regimes and to evaluate how grain-size variability affects the interpretation of backscatter in terms of FAC. Specifically, we: (i) assess the interannual variability of grain size and FAC and their respective relationships with ASCAT backscatter; (ii) identify systematic discrepancies between IMAU-FDM grain-size estimates and ASCAT-conditioned optimized values, particularly in regions influenced by melt-refreezing processes; and (iii) derive a more interpretable backscatter–FAC relationship by statistically reducing grain-size-driven scatter, as a proof of concept for FAC-oriented interpretation of ASCAT that informs future development of FAC-oriented diagnostic retrieval approaches. Throughout this study, the retrieved grain size is interpreted as an effective parameter conditioned by ASCAT observations within the adopted FDM–SMRT framework. The remainder of this paper is structured as follows: Sect. 2 describes the datasets used, including the ASCAT backscatter and IMAU-FDM simulations. Section 3 outlines the methodology, detailing the FDM-SMRT coupling framework, the sensitivity experiments, and the grain size optimization approach. Section 4 presents the results, comparing optimized and modeled grain size, evaluating the relationship between FAC and ASCAT backscatter, and analyzing the spatial distribution of firn properties across Antarctic ice shelves. Finally, Sect. 5 discusses the implications of our findings for firn modeling and ice shelf stability assessment.
To assess firn properties across Antarctic ice shelves, we use a combination of active microwave satellite observations, firn model outputs, and optical remote sensing data for validation. Below, we describe each dataset, its relevance to this study, and the pre-processing steps applied.
2.1 C-band ASCAT Observations
The C-band Advanced Scatterometer (ASCAT) provides active microwave backscatter measurements that are highly sensitive to the firn microstructure, making it a valuable tool for assessing spatio-temporal variations in firn properties. ASCAT can penetrate several meters into the firn, allowing it to capture changes in grain size and FAC across ice shelves. For this study, we use vertically polarized data at a frequency of 5.255 GHz, obtained from the Brigham Young University Microwave Earth Remote Sensing Laboratory (Long et al., 1993). The data is expressed in the point-slope form, where the normalized radar cross section (σ0, in dB space) measurement made by ASCAT is approximately a linear function of the incidence angle (θi)
where, θref is reference angle (i.e. a mid-swath value of 40° for ASCAT), A measured in dB is the value of σ0 normalized at 40° incidence angle, and B measured in dB per degree describes the dependence of σ0 on θi. The azimuth dependence of σ0 is discarded in this dataset as the σ0 values are largely azimuth-independent over most of the regions of the Earth (Long et al., 1993). As per Eq. (1), we use the A parameter for our analysis because after removing the incidence angle dependence, A is sensitive to depth-weighted near surface (i.e. ≈ upper 20 m) snow grain size (Fraser et al., 2016).
The original data have a resolution of 4.45 km, but are resampled to 27 km using a Nearest-Neighbor method to match the spatial resolution of IMAU-FDM. This resampling preserves the original backscatter signal without introducing interpolation artifacts. To minimize the direct influence of active melt, transient liquid water, and short-lived seasonal effects on the ASCAT signal, we focus on winter (June, July, and August, or JJA) mean backscatter values for each year between 2007 and 2021. The annual JJA means are calculated from the original ASCAT observations in dB space. This choice is intended to isolate a more stable interannual signal related to firn microstructure, yielding 15 values per pixel for temporal analysis. Pixels of Antarctic ice shelves that experienced major calving (i.e., where Greene et al., 2022's annual calving‐front outline indicates a retreat or advance crossing the 27 km grid cell boundary in any year) were excluded from all years of analysis.
2.2 Model Data
The IMAU Firn Densification Model (IMAU-FDM) is a semi-empirical 1D model that simulates the vertical evolution of firn layers under the influence of surface mass balance (SMB) processes (Veldhuijsen et al., 2024). It provides high-resolution estimates of key firn properties, including density, temperature, FAC, and grain size, making it a widely used tool for Antarctic firn studies. However, grain size evolution in IMAU-FDM is parameterized with simplified assumptions that do not explicitly account for refreezing-driven grain growth, leading to potential discrepancies in melt-affected regions (Veldhuijsen et al., 2024). This limitation motivates the need for ASCAT-based optimization in our study.
We use IMAU-FDM v1.2AD, which explicitly models grain growth as a function of temperature but does not incorporate direct observational constraints (Veldhuijsen et al., 2024). The model is forced with three-hourly fields of surface temperature, wind speed, snowfall, sublimation, snowdrift erosion, and melt from RACMO2.3p2 regional climate model outputs, driven by ERA5 reanalysis (van Wessem et al., 2018). The horizontal resolution of 27 km is set by RACMO2.3p2's grid spacing. IMAU-FDM output is available at a 10 d temporal resolution and a 4 cm vertical resolution.
To drive our coupled FDM–SMRT backscatter simulations at the same temporal spacing, we extract the required IMAU-FDM firn profiles at 10 d intervals. SMRT then uses the prescribed layer thickness, density, temperature, and liquid water content, together with the microstructural parameter, specified for the corresponding experiment, to produce synthetic backscatter intensity time series (see Sect. 3.2). From these simulations, we calculate annual JJA means in dB space for 2007–2021, consistent with the temporal aggregation applied to the ASCAT observations. This results in 15 FDM-SMRT winter-mean backscatter values per pixel for comparison with ASCAT.
In addition, we derive Melt-over-Accumulation (MoA) from RACMO2.3p2 data as an independent metric of firn melt intensity. MoA is defined as the ratio of total liquid water production (melt + rainfall) to snow accumulation (snowfall − sublimation) (van Wessem et al., 2018, 2023) over the study period (2007–2021). This MoA parameter helps distinguish regions where firn depletion is driven by sustained meltwater production, providing insight into areas where ASCAT backscatter and FAC may be strongly affected by refreezing processes.
2.3 Sentinel-2 Melt Pond Volume
To assess the relationship between firn saturation and microwave backscatter, we use melt pond volume estimates derived from Sentinel-2 optical imagery. Melt pond formation serves as a sensitive indicator of firn depletion and ice-shelf weakening, since refreezing of ponded water creates impermeable ice lenses that promote hydrofracture (van Wessem et al., 2023). This dataset therefore provides an independent contextual indicator of firn depletion for comparison with the ASCAT-based assessment.
The melt pond dataset includes austral summer (December–February) estimates from 2015 to 2022. Sentinel-2 imagery is processed using an automated water classification algorithm (Moussavi et al., 2020), which identifies liquid water features based on spectral reflectance characteristics (van Wessem et al., 2023). To facilitate comparison with IMAU-FDM and ASCAT data, we aggregate melt pond volumes onto the RACMO2.3p2 grid.
This section describes the methodology used to retrieve ASCAT-conditioned effective firn grain size estimates by integrating IMAU-FDM outputs with ASCAT backscatter via the Snow Microwave Radiative Transfer (SMRT) model. Throughout the workflow, firn stratigraphy is prescribed from IMAU-FDM, including layer thickness, density, temperature, and liquid water content. Within this prescribed framework, the inversion estimates one annual, column-wide correlation length representative of the upper firn column sampled by ASCAT, which is subsequently converted to an effective grain-size parameter. The retrieved parameter is then evaluated and interpreted through sensitivity and post-inversion diagnostic analyses.
We first establish a baseline by comparing winter-mean ASCAT backscatter (A) with IMAU-FDM FAC and grain size, RACMO MoA, and Sentinel-2 melt-pond volume to identify depleted firn regions and motivate the subsequent analysis (Sect. 3.1). Next, we describe the FDM–SMRT coupling framework and targeted sensitivity experiments to quantify how C-band backscatter responds to grain size across contrasting firn regimes, thereby motivating the grain-size inversion (Sect. 3.2). We then perform the core inversion by iteratively optimizing one annual correlation length to minimize the misfit with observed backscatter and subsequently convert it to an effective grain-size parameter (Sect. 3.3). The sensitivity of the retrieved parameter to selected assumptions in the prescribed firn state and forward-model configuration is then evaluated using a controlled one-at-a-time perturbation analysis (Sect. 3.4). Finally, we apply two post-inversion diagnostic analyses: a variance-partitioning ANOVA to examine how ASCAT variability projects onto FAC and grain size (Sect. 3.5), and grain-size standardization to assess how the backscatter–FAC relationship changes once grain-size-driven scatter is reduced (Sect. 3.6).
3.1 Comparison of IMAU-FDM/RACMO2 outputs with ASCAT Observations
To establish a baseline, we compare winter-mean ASCAT backscatter with IMAU-FDM FAC and grain size, and RACMO2 MoA. For each parameter, we compute the pixelwise long-term winter-mean value and generate scatterplot of ASCAT backscatter versus (a) FAC, (b) MoA, and (c) Grain Size across Antarctic ice shelves, coloring points by Sentinel-2 melt-pond volume to highlight cells with persistent ponding, indicative of reduced pore space and higher saturation, versus cells with little or no pond signal. This baseline analysis identifies regions where modeled firn properties alone fail to capture observed backscatter variability, motivating the more detailed sensitivity and inversion experiments that follow.
3.2 Coupling IMAU-FDM to SMRT and targeted grain-size sensitivity
To evaluate how well IMAU-FDM–derived firn profiles reproduce observed radar returns and to set up our grain-size inversion, we couple the model outputs with the Snow Microwave Radiative Transfer (SMRT) model (Picard et al., 2018). In our configuration, the SMRT model represents the snowpack as a composite of multiple horizontally placed layers up to the penetration depth of the C-band radar signal (∼ 20 m depth) and simulates the volume scattering coefficient at both horizontal and vertical polarizations (Picard et al., 2018). Since the incident wavelength of ASCAT is 5.70 cm, we avoid using the sub-wavelength layer thickness in SMRT (4 cm, the original layer thickness from IMAU-FDM output). Instead, we merge two layers from IMAU-FDM output to create 8 cm layers that are appropriate for the ASCAT signal. For this, we use the average to preserve the bulk microstructural properties of the two sub-layers (Picard et al., 2018). Each layer is then characterized by temperature, liquid water content, and snow microstructure. We do not prescribe a reflective basal substrate in SMRT; instead, we approximate a semi-infinite lower boundary by setting the deepest layer thickness to 1000 m, so no separate “background” backscatter term is imposed (Picard et al., 2022b).
The representation of snow microstructure is critical in the SMRT model, as it directly influences the choice of formulation used to compute the backscatter (Picard et al., 2018). In our analysis, we represent snow microstructure using the exponential autocorrelation model, which is characterized by a single parameter, the correlation length lc (Picard et al., 2018). The correlation length is the parameter supplied directly to SMRT and has dimensions of length, characterizing the spatial autocorrelation of the two-phase microstructure (Mätzler, 2002). Under the adopted exponential representation, it can be empirically and theoretically related to specific surface area and to an equivalent microstructural size (Mätzler, 2002; Picard et al., 2022b). We express this density-dependent relationship for each firn layer j as
where reff,j is the phase-equivalent effective microstructural radius, lc,j is the correlation length, and ρj is the density of layer j. Furthermore, ρice=917 kg m−3 is the density of pure ice, fi,j is the ice volume fraction, and fa,j is the air volume fraction. When , Eq. (2) corresponds to an equivalent ice-grain radius. When , we invoke the air–ice phase-interchange symmetry of the adopted two-phase representation, and the resulting quantity is more appropriately interpreted as an equivalent pore-scale radius.
Using this microstructural representation, each SMRT layer is specified by its thickness, density, temperature, liquid water content, and correlation length. Layer thickness, density, temperature, and liquid water content are prescribed from the corresponding IMAU-FDM profiles, whereas the correlation length is assigned according to the sensitivity or inversion experiment described below. We use the JJA IMAU-FDM profiles from 2007 to 2021 across Antarctic ice shelves and configure SMRT using the ASCAT frequency of 5.255 GHz and an incidence angle of 40°. For the electromagnetic model, we use the symmetrized Strong-Contrast Expansion under the non-local approximation (SymSCE) (Picard et al., 2022a). This formulation avoids the breakdown that can occur in other scattering theories for intermediate densities (450–550 kg m−3), particularly at high frequencies and for coarse-grained snow (Picard et al., 2022a). The multilayer radiative transfer equation is solved using the discrete-ordinate method (Picard et al., 2018).
Because grain size is one of the main sources of uncertainty in IMAU-FDM's microstructure (Veldhuijsen et al., 2024) and exerts a strong influence on C-band backscatter (Picard et al., 2022b), we perform a targeted grain-size sensitivity experiment. At the same time, ASCAT backscatter is also influenced by other aspects of firn structure, including density, layering, and ice saturation. However, the annual winter-mean ASCAT backscatter time series does not provide sufficient independent information to constrain all vertically varying firn properties simultaneously. We therefore prescribe firn stratigraphy from IMAU-FDM and restrict the analysis to a single column-wide microstructural degree of freedom: effective grain size in the forward sensitivity experiment and correlation length in the annual inversion.
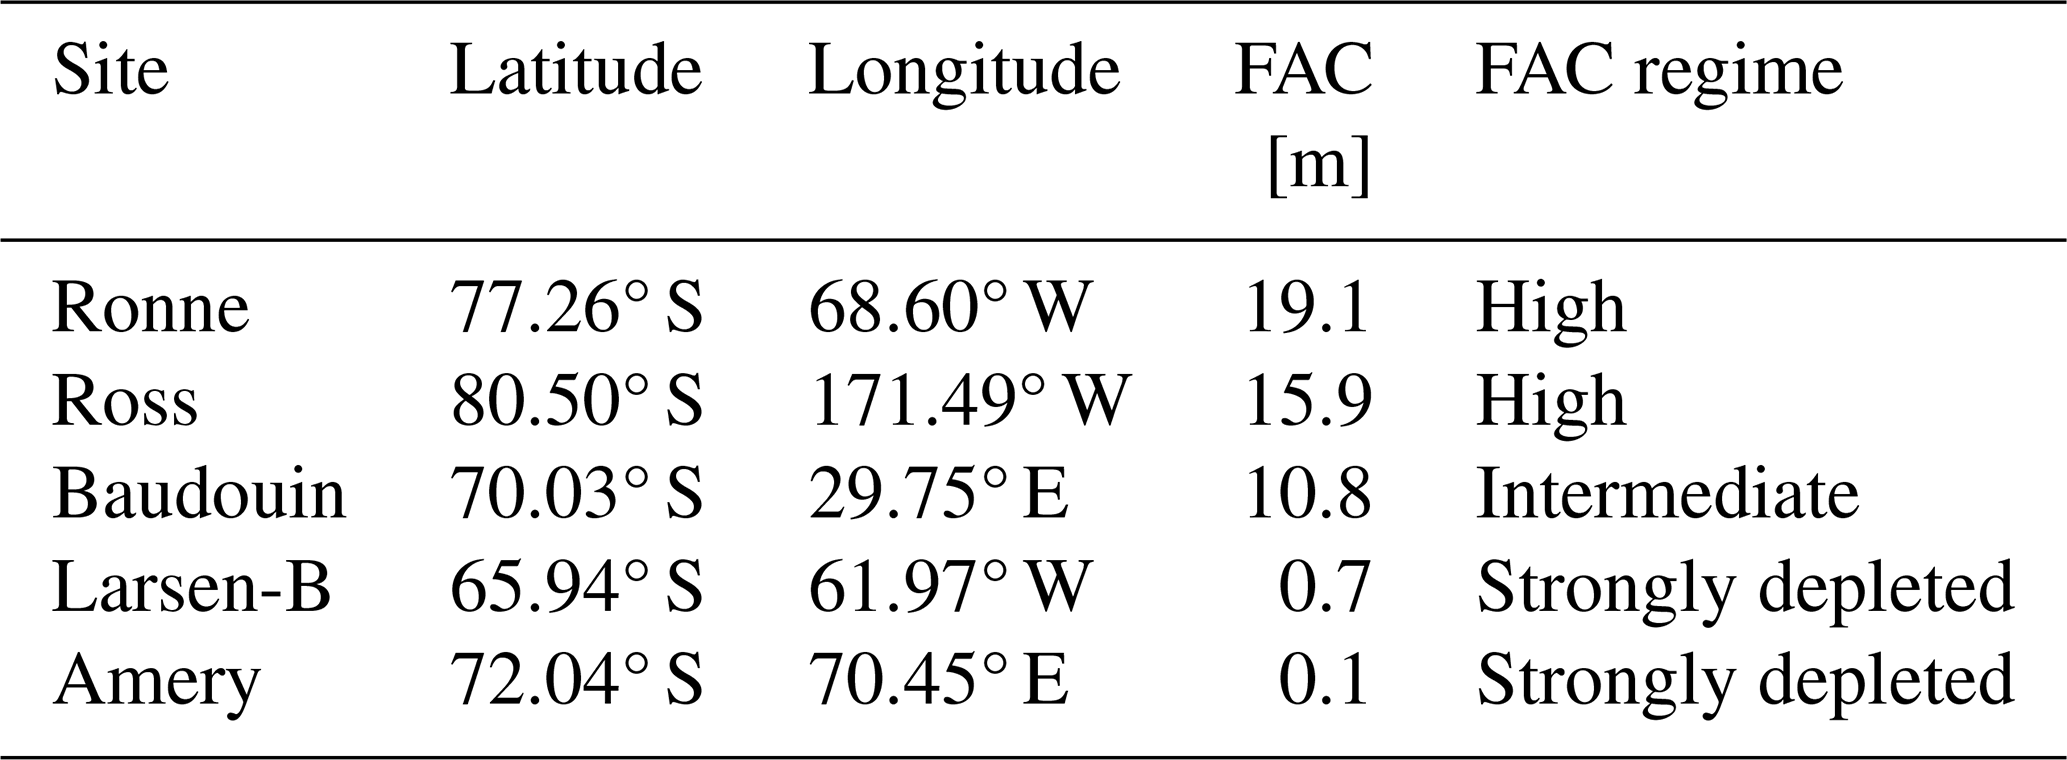
To examine the sensitivity of backscatter to grain size across contrasting firn regimes, we selected five representative 27 km grid cells spanning high-, intermediate-, and strongly depleted FAC conditions. The cells were selected according to three criteria: (i) they span the range of long-term winter-mean FAC conditions observed across Antarctic ice shelves; (ii) they contain complete ASCAT and IMAU-FDM records for 2007–2021; and (iii) they lie within the analysis ice-shelf mask and were retained after the calving-front screening applied for 2007–2021. The selected sites comprise two high-FAC cells (> 15 m) on the Ross and Ronne ice shelves, one intermediate-FAC cell (5–15 m) in the Baudouin blue-ice region, and two strongly depleted cells (< 1.5 m) on the Amery and Larsen-B ice shelves. Their coordinates and long-term mean FAC values are listed in Table 1. These sites are used as illustrative examples of contrasting firn regimes and are not intended to constitute a statistically representative sample of each regime.
Table 1Locations and long-term winter-mean IMAU-FDM firn air content (FAC) of the five 27 km grid cells used in the sensitivity experiment shown in Fig. 2. Coordinates identify the selected locations used to locate the corresponding 27 km grid cells.
Because the Larsen-B remnant borders the Larsen B embayment, which was frequently occupied by seasonal sea ice after the 2002 collapse and by multi-year landfast sea ice from 2011 until January 2022 (Ochwat et al., 2024), we performed an additional spatial verification of this footprint. We identified the exact 27 km raster cell containing the selected coordinate from the IMAU-FDM FAC grid and compared its 729 km2 footprint with the annual Antarctic coastlines of Greene et al. (2022) for each year from 2007 to 2021. For every year, we calculated the fraction of the footprint within the mapped Antarctic ice extent and its minimum distance from the coastline. The full footprint remained within the mapped ice extent in all 15 years, with a minimum cell-edge distance of 1.6 km from the annual coastline. The selected coordinate also falls within the Larsen-B polygon of the ice-shelf mask, supporting its interpretation as persistent Larsen-B remnant ice rather than adjacent sea ice.
For each site, we extract the long-term (2007–2021) winter-mean IMAU-FDM firn profile, including density and temperature. We prescribe a single trial effective grain-size parameter uniformly with depth across the upper 20 m. For each trial grain size, Eq. (2) is rearranged to calculate the corresponding density-dependent correlation length for every firn layer. These layer-specific correlation lengths are then supplied to SMRT. We systematically vary the trial effective grain-size parameter from 0 to 10 mm in 0.5 mm increments and simulate winter-mean backscatter at each value. This experiment quantifies how the sensitivity of simulated C-band backscatter to effective grain size varies between high-, intermediate-, and strongly depleted FAC regimes.
However, C-band backscatter is also sensitive to the firn's saturation state described by FAC; a grain–size–only experiment thus cannot capture variability arising from density/FAC effects. Moreover, because FAC is not a direct input to SMRT (whereas density is), we include a complementary 2-D sensitivity that varies both density and grain size built from an IMAU-FDM firn column. From a single FDM profile, we take the time-mean layer thickness and temperature for the upper 20 m and hold these fixed.
We then generate a grid of snowpacks by assigning a uniform density ρ (in the range of 10–910 kg m−3) along the column and a uniform effective grain size r (in the range of 0.01–1.2 mm) to all layers. For each (ρ,r) pair, Eq. (2) is rearranged to calculate the corresponding correlation length supplied to SMRT. We then simulate the backscatter using the ASCAT sensor configuration and display the resulting response as a contour heatmap. To link density to FAC in this controlled setting, we translate uniform density to its equivalent 20 m FAC (depth-integrated air content) using equation 4 in Ligtenberg et al. (2014). This design isolates how backscatter varies with grain size versus density/FAC under identical vertical geometry and thermal state, clarifying regimes where the backscatter is microstructure-dominated versus FAC-dominated.
3.3 Optimization of correlation length and derivation of effective grain size
Because IMAU-FDM's grain-growth scheme is parameterized rather than directly constrained by observations (Veldhuijsen et al., 2024), its native grain-size output may not fully represent the effective microstructure seen by ASCAT. We therefore optimize a single, column-wide exponential correlation length for each 27 km grid cell and subsequently convert it to an ASCAT-conditioned effective grain-size parameter.
For each grid cell and year, we run the FDM-SMRT coupled model for all available IMAU-FDM profiles during JJA months. The resulting simulated backscatter values are averaged in dB space to obtain one annual JJA value, following the same temporal aggregation applied to the ASCAT observations. The annual JJA values for both the simulations and observations are then converted from dB to linear units before evaluating the inversion objective. Because temporal averaging is performed in logarithmic space, the converted annual value corresponds to the geometric, rather than arithmetic, mean of the individual linear backscatter values. We retain this formulation to ensure consistent temporal aggregation of ASCAT observations and FDM-SMRT simulations in the dB domain. The converted simulated annual value is denoted by , and the exponential correlation length is optimized independently for each year by minimizing the squared difference between the simulated and observed annual values in linear units:
Here, is the set of analysis years, and is the optimized correlation length for year t. The inversion is repeated independently for every year in 𝒴, yielding one optimized correlation length per grid cell and year.
The optimized annual correlation length is converted to the reported effective grain-size parameter using Eq. (2) and the corresponding same-year JJA IMAU-FDM density profiles, averaged over the upper ∼ 20 m firn column and the available JJA model time steps. We solve Eq. (3) using the bounded Limited-memory Broyden–Fletcher–Goldfarb–Shanno algorithm (L-BFGS-B), implemented through SciPy, because it efficiently solves the optimization problem without requiring explicit computation of the Hessian matrix (Virtanen et al., 2020). Given the computational expense of the optimization, we used the DelftBlue supercomputer (Delft High Performance Computing Centre, 2024) and parallelized the calculations across 16 cores while processing approximately 2000 grid cells.
Because only one annual scalar parameter is retrieved from one annual JJA-mean ASCAT observation, the inversion cannot independently resolve vertical or sub-seasonal variations in firn microstructure. The reported effective grain-size parameter should therefore be interpreted as an ASCAT-conditioned, column-integrated retrieval parameter within the adopted FDM–SMRT framework, rather than as a direct measurement of individual physical grains or as a depth-resolved physical grain-size profile.
By repeating the optimization for each year from 2007 to 2021, we estimate the interannual variability of the optimized effective grain-size parameter, particularly in regions where melt and refreezing may alter firn microstructure through time. Here, “effective” refers to the ASCAT-conditioned parameter inferred through the inversion. As part of our analysis, we examine the spatial variability in grain size regimes across regions with different firn conditions. We further compare the optimized grain size with the mean grain size of the upper 20 m in IMAU-FDM to evaluate how well IMAU-FDM estimates the grain size at the Antarctic-ice-shelf-wide scale.
Because IMAU-FDM's grain‐growth parameterization is weakly constrained under ice-saturated conditions (Veldhuijsen et al., 2024), where refreezing dominates and pore space is exhausted, we perform a targeted sensitivity test on depleted firn, where the largest differences between IMAU-FDM grain-size estimates and ASCAT-conditioned optimized values are expected. Across Antarctic ice shelves, we select all the cells with FAC < 1.5 m (34 cells total), extract each cell's ice-saturation depth, and compute the grain-size difference () for those cells. Here, ice saturation is a threshold concept: we define the ice-saturation depth as the shallowest depth at which the modeled firn density equals that of solid ice. This differs from FAC, which is a continuous, column-integrated air-volume metric derived from the vertical density profile. We then examine the relationship between Δr and ice-saturation depth to diagnose how deep versus shallow ice-saturation affects the grain size differences.
3.4 Perturbation analysis of the effective grain-size retrieval
The annual inversion retrieves one column-wide correlation length while density, temperature, liquid water content, and vertical layering are prescribed from IMAU-FDM. Consequently, the resulting ASCAT-conditioned effective grain-size parameter may depend not only on the observed backscatter, but also on uncertainties and simplifying assumptions in the prescribed firn state and FDM-SMRT forward-model configuration. We therefore perform a controlled one-at-a-time perturbation analysis to quantify the sensitivity of the retrieved parameter to selected prescribed model assumptions.
For this analysis, we select a high-FAC dry-firn case to provide a comparatively simple benchmark state. Dry, porous firn is less affected by melt-driven pore-space depletion, near-surface ice saturation, and extensive refrozen layers than strongly depleted firn (Alley et al., 2018; Veldhuijsen et al., 2024). This reduces the number of competing firn processes that could influence the simulated backscatter and allows the response to each imposed perturbation to be examined under a controlled baseline configuration. The choice of a high-FAC case is therefore intended to isolate sensitivity to the prescribed model assumptions, rather than to represent the full range of conditions encountered across Antarctic ice shelves. We use the Ross Ice Shelf site listed in Table 1 as the high-FAC dry-firn benchmark. The site has a long-term winter-mean FAC of 15.9 m and contains complete ASCAT and IMAU-FDM records for 2007–2021. It therefore provides a consistent baseline profile and observational record for applying the prescribed perturbations. The resulting sensitivities are specific to this controlled dry-firn setting.
We construct the baseline by averaging all available 10 d JJA IMAU-FDM profiles for the Ross site over 2007–2021, using the same 8 cm vertical aggregation and SMRT configuration described in Sect. 3.2. The observational target is the long-term mean of the annual JJA ASCAT backscatter in linear units and is converted to dB only for reporting. For each one-at-a-time perturbation, the correlation length is re-optimized using the modified firn profile or backscatter target, together with the objective function, optimization bounds, and solver described in Sect. 3.3. The resulting optimized correlation length is converted to an effective microstructural radius using Eq. (2) and the density profile of the corresponding scenario.
We apply five categories of one-at-a-time perturbation to evaluate retrieval sensitivity. First, we test sensitivity to the prescribed density profile by applying a relative perturbation of ±5 % to the baseline layer porosity. For each layer, porosity is defined as (Clerx et al., 2022; Veldhuijsen et al., 2024) and is perturbed according to , where . The corresponding perturbed density is then calculated as . Consequently, produces a denser, lower-porosity profile, whereas produces a less dense, higher-porosity profile.
Second, we test sensitivity to the vertical representation of the firn column by merging adjacent 8 cm layers to form a 16 cm profile while preserving the layer-mean bulk properties. Third, we examine sensitivity to the presence and depth of an idealized dense layer by assigning a density of 900 kg m−3 to one 8 cm layer nearest to target depths of 0.5, 1.0, and 2.5 m. This controlled perturbation serves as an idealized analogue of a horizontally continuous ice lens within the one-dimensional SMRT column and isolates the influence of dense-layer depth on the retrieved parameter. Fourth, unresolved surface scattering and roughness-related contributions are not explicitly represented in the SMRT configuration. We therefore perturb the ASCAT target backscatter by ±0.5 dB to provide a primary bracket for sensitivity to unresolved surface-related backscatter. Additional offsets of ±1.0 dB are included as extended stress tests and are reported separately.
Fifth, we assess sensitivity to interannual variability in the prescribed firn state by replacing the long-term mean profile with the annual JJA profiles associated with the minimum and maximum vertically averaged profile temperatures in the 2007–2021 IMAU-FDM record. These occur in 2016 and 2020, with mean profile temperatures of 242.1 and 243.5 K, respectively. These temperatures represent averages over the modeled firn profile rather than near-surface air temperature. Because the complete annual JJA profiles are substituted, the perturbation includes concurrent interannual differences in density, temperature, liquid water content, and their vertical distributions, rather than varying temperature alone. The two profiles therefore bracket the modeled interannual full-profile states available for the selected Ross site.
For each scenario, we report the optimized correlation length, the corresponding effective grain-size parameter, and their absolute and relative changes from the baseline retrieval. We also record optimizer convergence, whether the solution reaches either optimization bound, and the residual between the simulated and prescribed target backscatter. A scenario is considered to reproduce its prescribed target when the absolute residual is below 0.01 dB. The perturbations are applied individually and define controlled sensitivity brackets rather than probabilistic uncertainty distributions. Their effects are not assumed to be independent or additive and are therefore not combined into a total retrieval uncertainty. The analysis thus quantifies retrieval sensitivity for the selected high-FAC Ross benchmark.
3.5 Variance partitioning of interannual ASCAT variability within the adopted framework
To examine how interannual ASCAT backscatter variability projects onto grain size and FAC within the adopted framework, we perform an Analysis of Variance (ANOVA) using the annual profiles of grain size and FAC (i.e., 15 values for the period 2007–2021). ANOVA is used here as a variance-partitioning tool to decompose the year-to-year variability in backscatter into fractional contributions associated with FAC, grain size, their interaction, and a residual term (Gelman, 2005). This decomposition is statistical and assumes that the variability can be represented, to first order, by approximately additive contributions from FAC, grain size, their interaction, and a residual term over the sampled range of interannual variability. It should therefore not be interpreted as implying that the underlying firn–microwave scattering physics are strictly additive. Moreover, because the optimized grain size is inferred by fitting FDM–SMRT simulations to ASCAT observations, this analysis should be interpreted as a conditional diagnostic within the adopted framework rather than as an independent attribution of ASCAT variability.
To assess how these fractional contributions shift across different firn saturation states, we group all 27 km cells into 50 quantile‐based FAC bins (based on their long‐term mean FAC). Within each bin, we compute the mean and interquartile range (IQR = Q75 − Q25) of the ANOVA‐derived fractions after optimization: the FAC main effect fFAC, the grain-size main effect fr, the interaction term fFAC×r, and the residual fraction . We use the IQR because it robustly captures the central 50% of the bin‐to‐bin variability without being skewed by extreme outliers. We then normalize both the mean and the IQR of each component by the total mean variance in that bin, yielding fractional contributions and fractional IQRs that sum to unity. This normalization is purely statistical (a rescaling of variance fractions for comparability across FAC bins) and does not modify the underlying physical sensitivity of ASCAT backscatter. Finally, by plotting these binned statistics against the bin's average FAC, we identify the FAC regimes in which grain size or FAC contributes more strongly to the partitioned ASCAT variability and quantify the uncertainty (via the IQR bands) associated with these fractional contributions.
3.6 Assessment of the backscatter–FAC relationship after grain-size standardization
We explore a proof of concept for interpreting ASCAT backscatter in terms of FAC by standardizing grain size to reduce grain-size-induced spread in the backscatter-FAC relationship. First, we perform the physical inversion and retrieve an optimized grain size ropt for each grid cell and year by minimizing the mismatch between FDM-SMRT-simulated and ASCAT-observed backscatter, given the IMAU-FDM stratigraphy (as in Sect. 3.3). We then apply a purely statistical post-processing step: using all paired winter-mean (FAC,ropt) values across Antarctic ice shelves, we fit a smooth cross-cell central tendency rstd(FAC) (represented by a power law fitted by ordinary least squares as the FAC–grain size relationship is non‐linear (Veldhuijsen et al., 2024)). This fitted function assigns each FAC value a single “standardized” grain size rstd, which we use only after inversion.
The motivation for this standardization is that C-band backscatter is highly sensitive to microstructure (grain size). Therefore, when examining backscatter as a function of FAC across many cells, inter-cell and interannual variations in grain size introduce additional spread even at a fixed FAC (i.e., “grain-size-driven scatter”). By replacing ropt with rstd(FAC), we treat grain-size variability as a nuisance source of scatter and obtain a more interpretable diagnostic backscatter-FAC curve that more directly reflects the FAC sensitivity. Importantly, rstd(FAC) is not used as a prior or constraint in the inversion and is not interpreted as a unique physical law relating FAC and grain size. Finally, we compare Astd values with FAC to evaluate the standardized backscatter–FAC relationship, i.e., after reducing the spread caused by inter-cell and interannual grain-size deviations.
4.1 Comparison of ASCAT backscatter with IMAU-FDM/RACMO2 Outputs
Figure 1 illustrates the relationship between ASCAT observations, IMAU-FDM FAC, grain size and MoA from RACMO2.3p2 across Antarctic ice shelves, alongside the S-2 integrated melt pond volume. In Fig. 1a, we observe large spatial variability in the winter mean ASCAT backscatter for the period from 2007 to 2021, with notably distinct spatial patterns recorded in ASCAT data (i.e. transition from low to high backscatter and vice versa) for the Amery, Ross, and Filchner-Ronne ice shelves. Figure 1b reveals the characteristic inverted U-curve between winter-mean ASCAT backscatter and IMAU-FDM FAC (Alley et al., 2018), i.e., backscatter peaks at intermediate FAC and is lower at both low and high FAC. Figure 1c shows the same pattern against RACMO2 MoA. In both panels, the Sentinel-2 melt pond volume is overlaid, which demonstrates a strong link with depleted firn conditions.
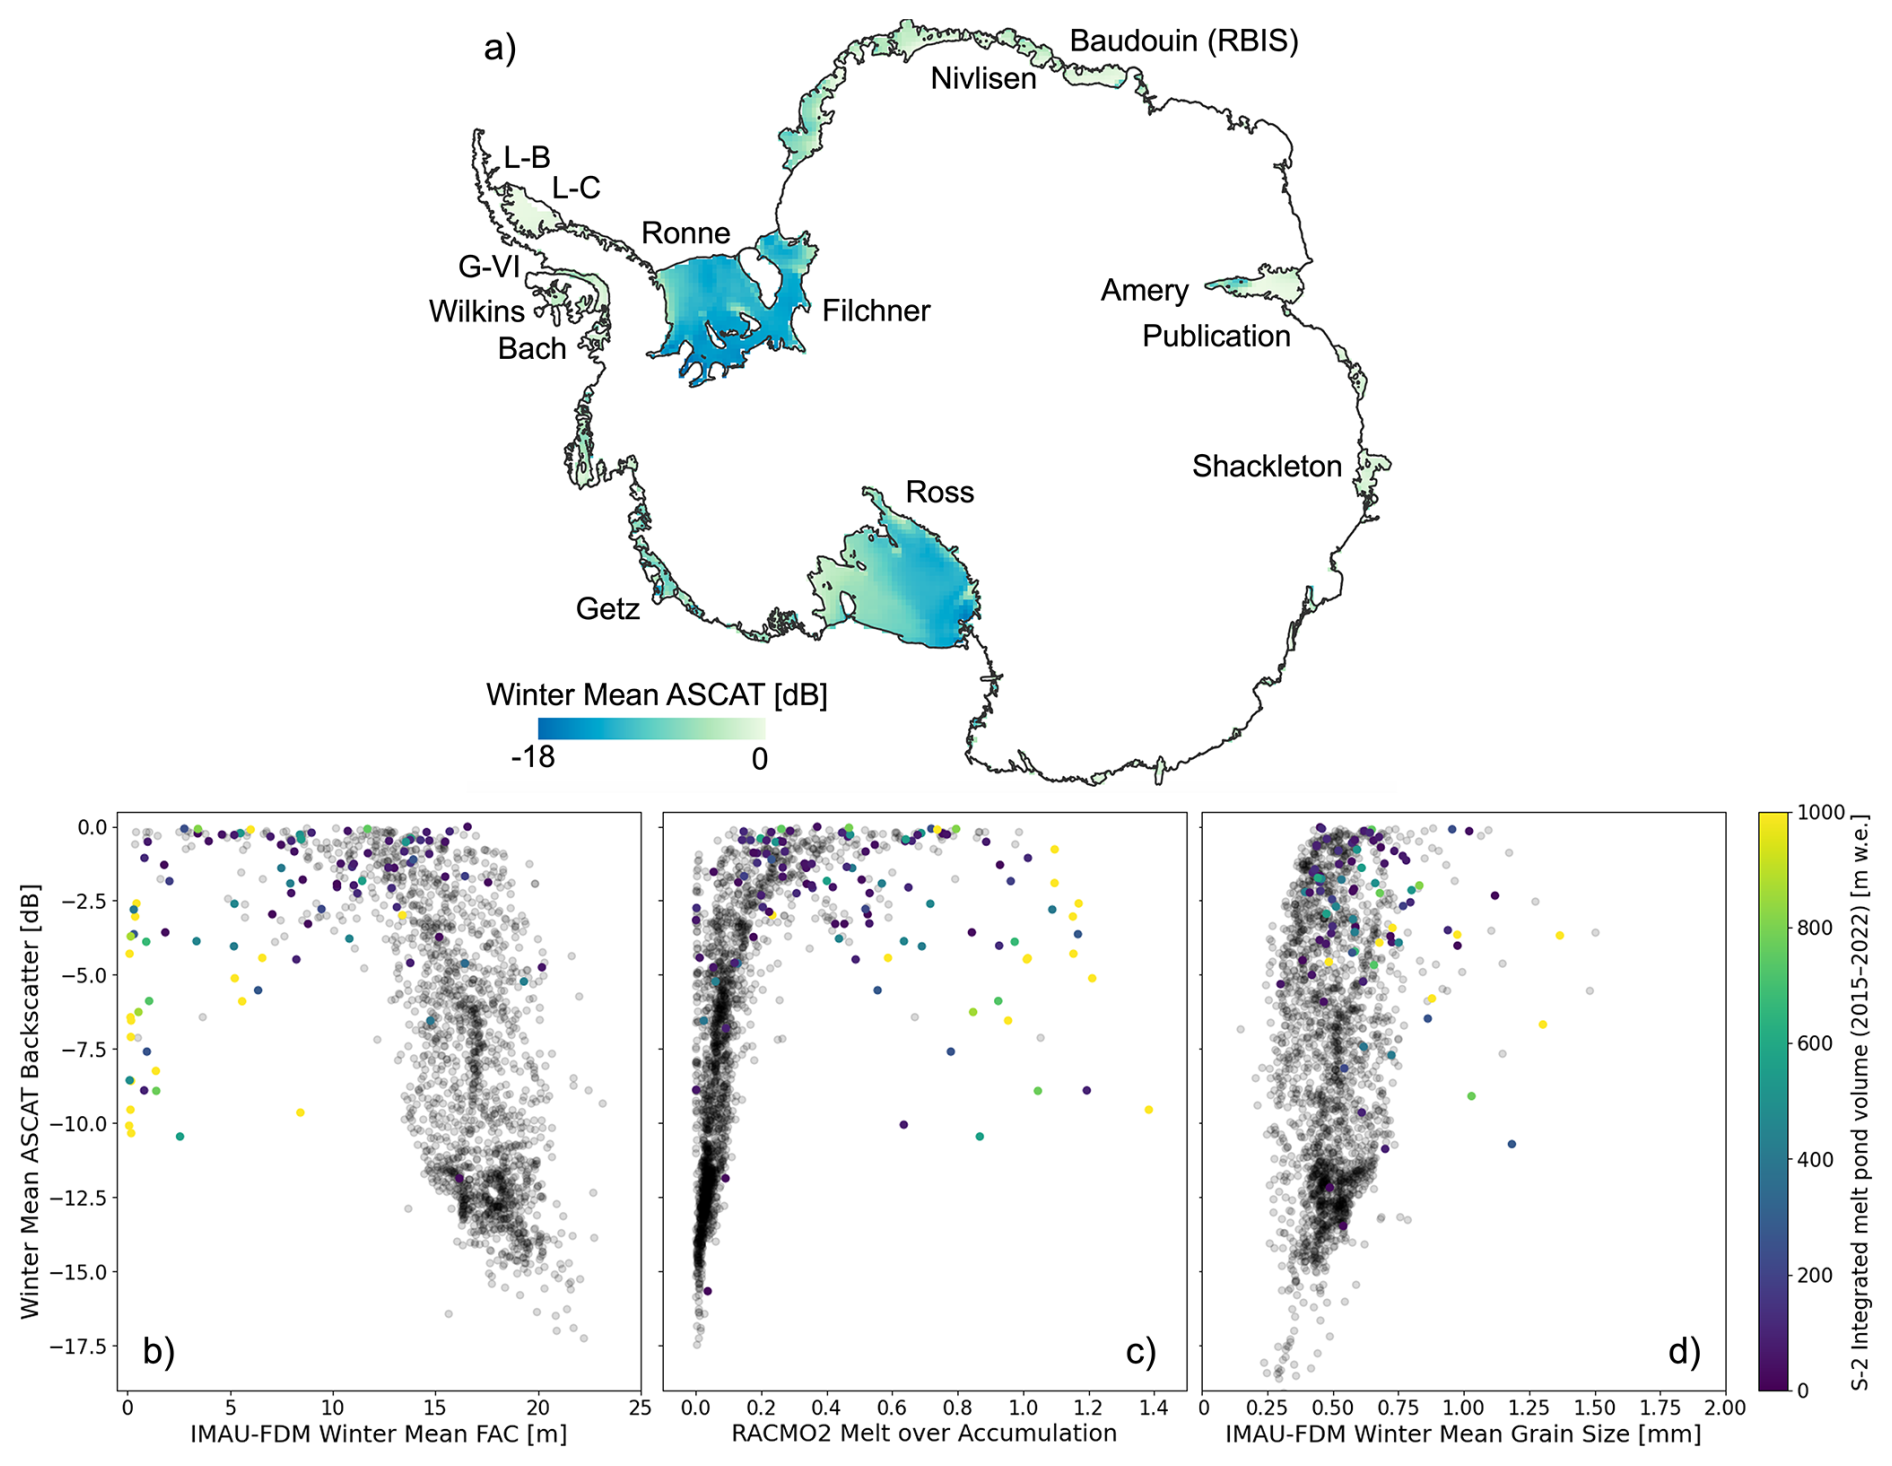
Figure 1(a) 2007–2021 winter mean ASCAT backscatter at the Antarctic-ice-shelf-wide scale. The relationship between winter mean ASCAT and (b) IMAU-FDM FAC (i.e. inverted U-curve), (c) RACMO2 Melt over Accumulation (MoA), and (d) IMAU-FDM Grain Size with S-2 integrated melt pond volume in color whereas gray points are the regions with no S-2 melt pond data. G-VI is George-VI ice shelf, and L-B and L-C are Larsen-B and Larsen-C ice shelves respectively.
In regions with high FAC (which in general indicates a low MoA), the ASCAT backscatter is low because the snowpack consists of smaller grains, which remain transparent to the incoming radar signal. This transparency increases radar signal penetration and results in lower radar return values due to scattering losses in the snowpack. Conversely, as FAC decreases due to increased melt events, refreezing leads to larger grain sizes, thus increasing backscatter. However, in areas with low FAC, persistent melt can form thin refrozen ice lenses (typically < 10 cm thick) within the firn (Pfeffer et al., 1991). Although these lenses are density discontinuities, they behave like planar, specular reflectors: most of the radar energy is reflected away from the side-looking ASCAT antenna rather than back toward it. At the same time, the presence of one or two dominant ice layers suppresses the smaller‐scale grain‐boundary scatterers that normally drive diffuse volume backscatter, so the net result is a decrease in the measured radar return in regions of intense melt.
Such an inverted U-curve relationship can also be observed in Fig. 2 of Alley et al. (2018), which explores the connection between ASCAT backscatter and melt days in Antarctica. This finding strongly aligns with the behavior depicted in Fig. 1c of our study, wherein the ASCAT backscatter is compared with MoA. Figure 1d extends this baseline by showing winter-mean backscatter as a function of IMAU-FDM–modeled grain size. Here we see that backscatter rises as grain size increases from ≈ 0.2 mm up to ≈ 0.5 mm, where diffuse volume scattering is maximized, and then declines again for coarser grains as the number of grain-boundary interfaces per unit volume decreases and forward scattering/attenuation increases, which can dampen the C-band return (Picard et al., 2022a). Taken together, these baseline comparisons show that, although ASCAT backscatter is influenced by FAC and melt‐pond signals, variations in grain size exert a strong first‐order influence on C-band returns, highlighting the critical role of microstructural variability in driving the observed backscatter patterns.
4.2 Sensitivity of ASCAT backscatter to Grain Size in varying FAC regimes
Figure 2 demonstrates how backscatter sensitivity to microstructural versus saturation controls varies across contrasting firn regimes. Figure 2a shows the broad spatial variability in winter‐mean FAC across Antarctic ice shelves, ranging from the deeply porous firn of Ross and Ronne ice shelves in West and East Antarctica, through intermediate conditions in the Baudouin blue‐ice region, to the heavily depleted layers of Larsen-B and Amery ice shelves. To explore how these contrasting saturation states influence radar returns, we perform a sensitivity experiment targeted to five 27 km grid cells, which are mapped in Fig. 2a. Because Larsen-B represents an important depleted-firn case in the Antarctic Peninsula, the selected grid cell was chosen to remain within the ice-shelf mask throughout the study period, excluding surrounding sea-ice-covered areas.
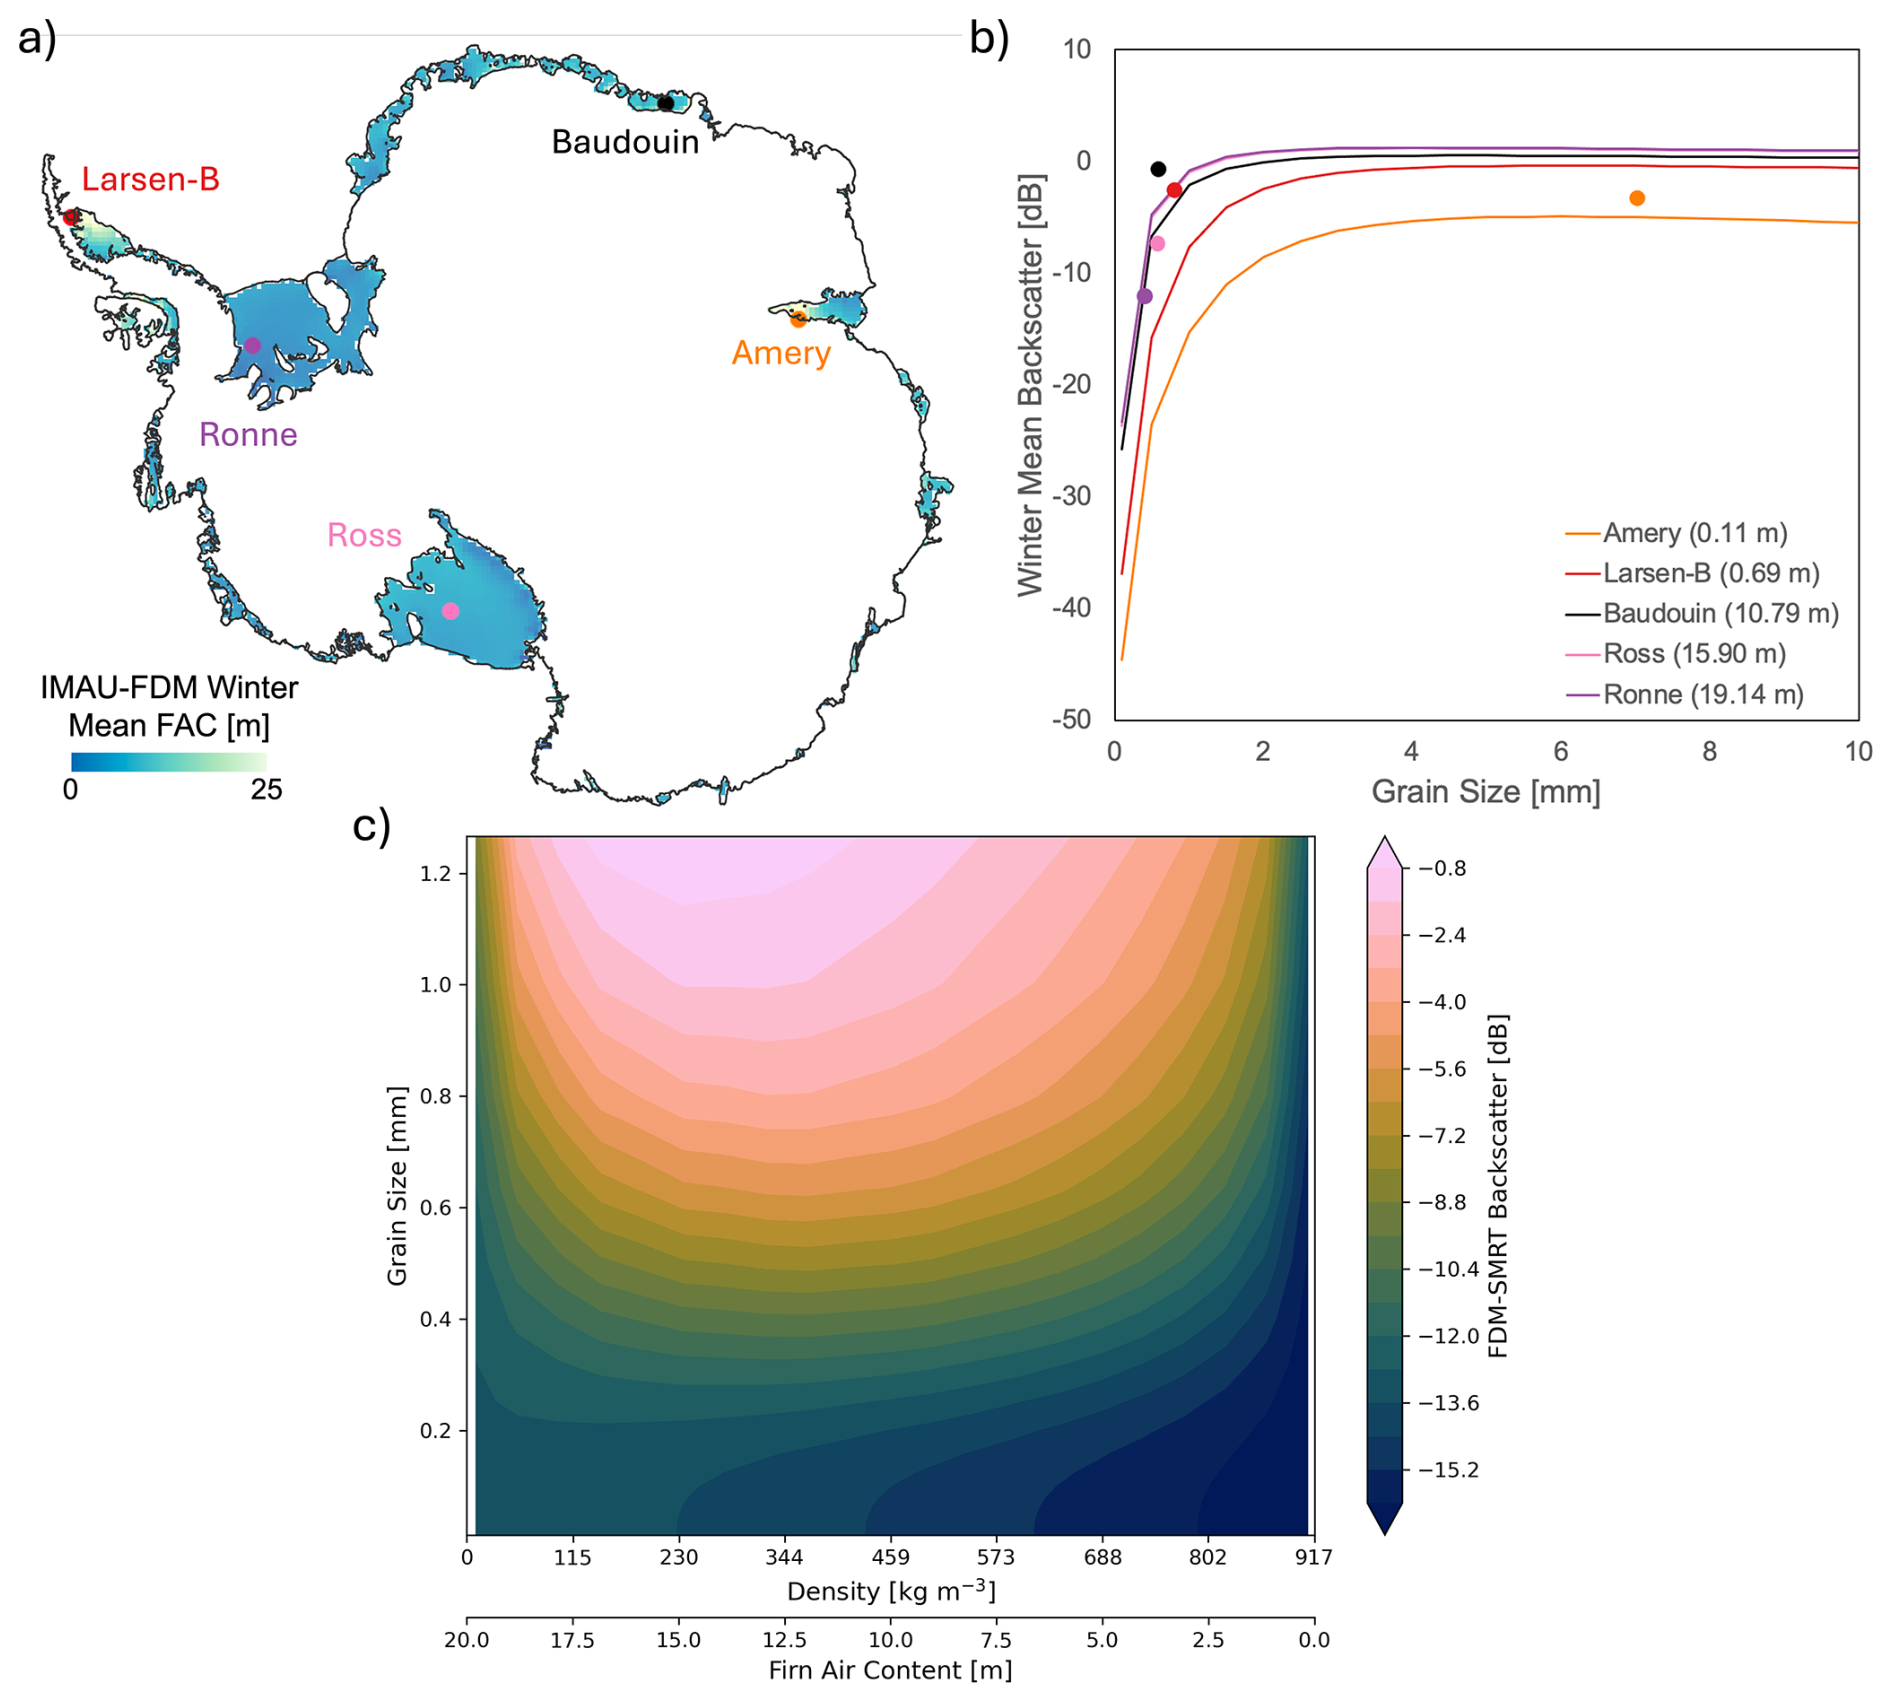
Figure 2(a) 2007–2021 IMAU-FDM winter mean FAC at the Antarctic-ice-shelf-wide scale. Five representative 27 km grid cells are shown using site-specific colors. (b) FDM-SMRT-simulated winter-mean backscatter as a function of prescribed effective grain size for the five sites. Colored circles show the observed ASCAT backscatter plotted at the corresponding IMAU-FDM grain size. Site colors are consistent between panels (a) and (b). In the legend, the winter mean FAC values from IMAU-FDM are noted in brackets for the respective locations. (c) 2-D sensitivity of FDM-SMRT simulated backscatter in color to grain size and density/FAC.
Across all sites, we notice that the FDM-SMRT simulated backscatter rises sharply as modeled grain size grows from near zero to about 1 mm, then plateaus for larger grains, demonstrating the classic volume scattering response of C-band waves (Picard et al., 2022b). Crucially, when we overplot the observed winter‐mean ASCAT backscatter (dots) at each site's IMAU-FDM grain size, nearly all points fall on the steep portion of the curve rather than in the flat plateau. This steepness further depends on the firn condition (i.e., FAC value). In regions with high FAC, such as Ross and Ronne, the increase is relatively steeper compared to regions with low FAC. Note that the Ross and Ronne curves nearly coincide because both represent dry, high-FAC firn (> 15 m), producing very similar backscatter responses. For the samples situated on the slope of the curve, even small errors in the modeled grain radius translate into multi‐decibel biases in the FDM-SMRT simulated backscatter.
Conversely, as firn conditions deplete, some samples approach the shallow-slope (“plateau”) part of the curve (e.g., Amery). In this regime, backscatter is less affected by variations in grain size; however, even a small change in FAC, from 0.7 m at Larsen-B to 0.1 m at Amery, is associated with a reduction in simulated backscatter from approximately 0 dB to around −5 dB. Thus, the five-site sensitivity test shows that ASCAT's grain-size leverage is strong on the steep limb, but weakens as shelves enter depleted (low FAC) conditions. To generalize this behavior beyond the five examples and make the density/FAC dimension explicit, we map the joint response σ0(ρ,r) in Fig. 2c. The 2-D surface shows that at intermediate densities (roughly ρ ∼ 200–700 kg m−3; mid-FAC for a 20 m column), backscatter varies most strongly with grain size: moving from small to moderate r produces large increases in σ0, while changes in ρ within this band have comparatively modest effect. By contrast, at the low-density/high-FAC and high-density/low-FAC ends, the surface becomes flat in r and steeper in ρ, indicating that the response is increasingly governed by the ice-saturation state rather than microstructure. In practical terms, ASCAT offers strong leverage to constrain grain size in the mid-density regime, whereas at very low or very high densities/FAC the signal is primarily modulated by density/FAC and grain size becomes more weakly identifiable. Importantly, the fact that ASCAT is sensitive to grain size enables us to refine it, providing an opportunity to better constrain one of the main sources of uncertainty in IMAU-FDM's firn microstructure (Veldhuijsen et al., 2024) and thereby reduce discrepancies in modeled grain-size-related scattering behaviour. In the next section, we do so by performing a full inversion of grain size against the winter-mean ASCAT backscatter.
4.3 Optimized grain size estimates at the Antarctic-ice-shelf-wide scale
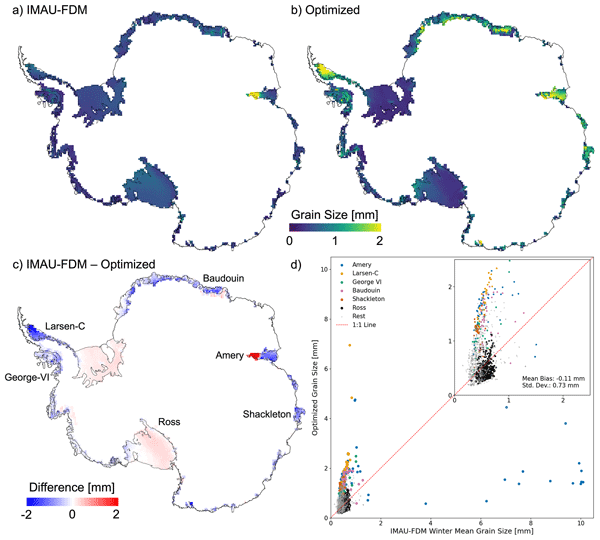
Figure 3 compares the mean grain size modeled from IMAU-FDM with the optimized grain size, using FDM-SMRT coupling and ASCAT observations, across the Antarctica ice shelves. The performance of the optimization between the FDM-SMRT coupled simulations and ASCAT observations is illustrated in the Appendix (Fig. A1). The results indicate that the FDM-SMRT coupled model closely reproduces the ASCAT backscatter after optimization, achieving a correlation value close to 1 and root mean square error of 0.18 dB. Because the optimized grain-size parameter is itself inferred by fitting the model to ASCAT, this agreement should be interpreted as internal consistency within the adopted framework and not as an independent validation of the retrieval. Accordingly, the comparison between IMAU-FDM grain size and the optimized grain-size parameter should not be interpreted as a direct comparison between modeled grain size and physical truth. Instead, deviations between the two indicate framework-dependent differences between the IMAU-FDM-prescribed firn state, the FDM–SMRT simulated scattering response, and the ASCAT-conditioned effective parameter retrieved by the inversion.
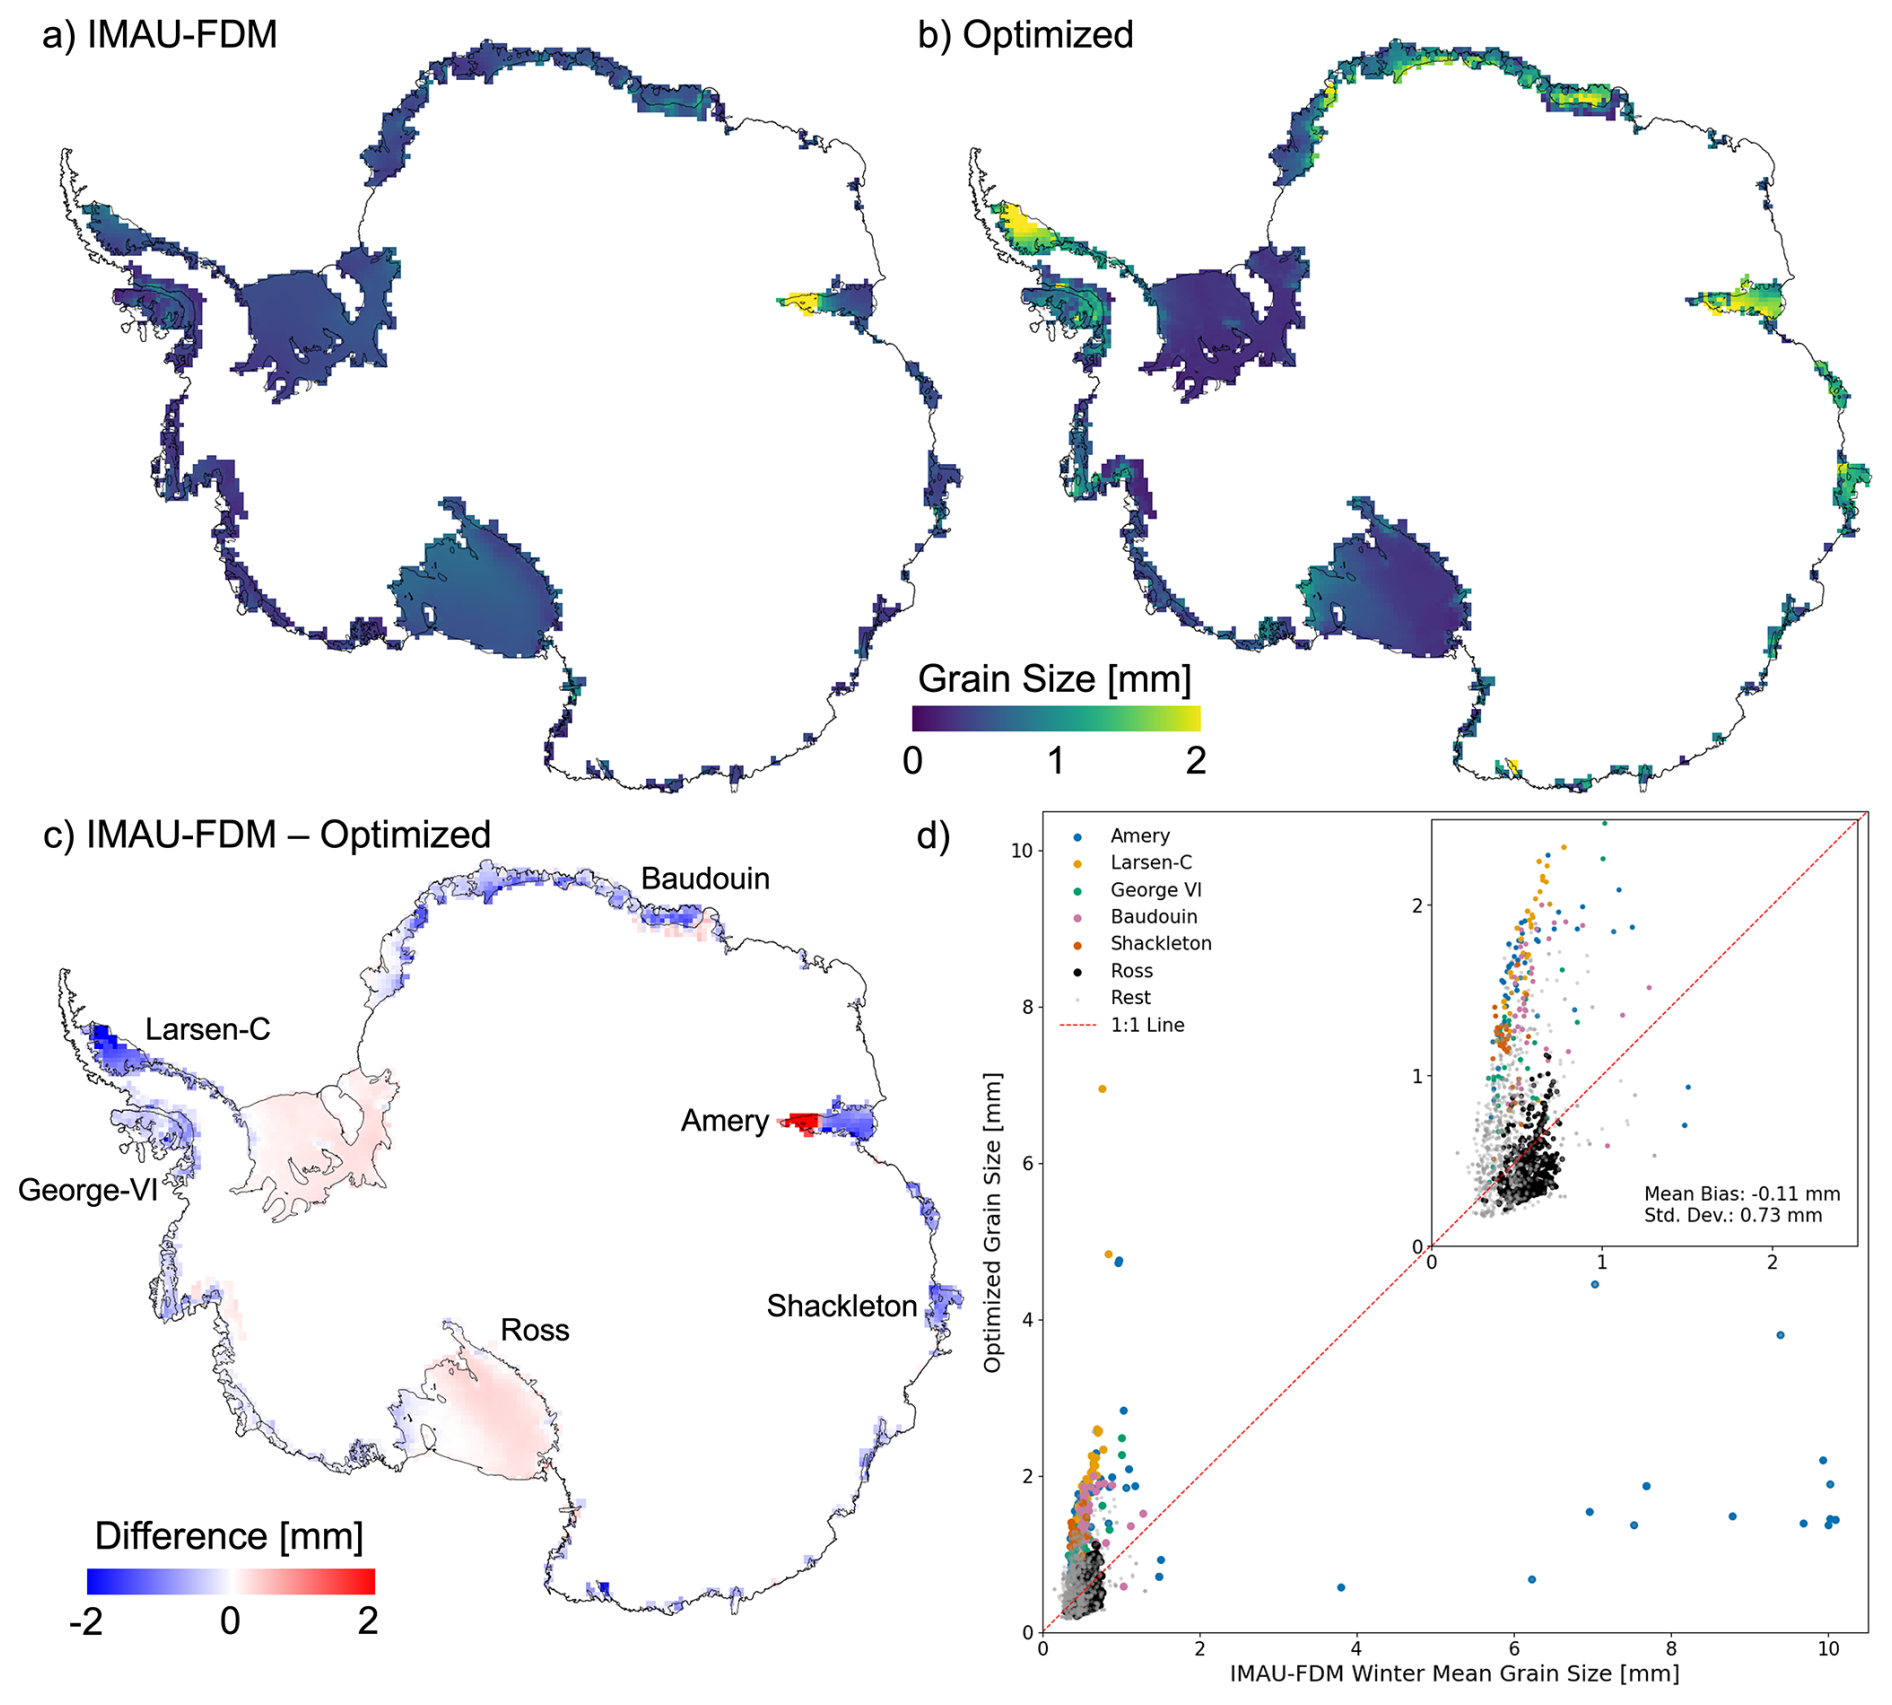
Figure 3(a) IMAU-FDM winter mean, (b) Optimized, (c) Difference (IMAU FDM − Optimized) grain size map, and (d) Comparison between IMAU-FDM winter mean and Optimized grain size at Antarctic-ice-shelf-wide scale. Inset zooms the [2.5, 2.5] mm range where most of the points fall. The data points of all other ice shelves are categorized in “Rest” class, indicated by grey colour.
In Fig. 3a and b, IMAU-FDM grain-size estimates are generally lower than the ASCAT-conditioned optimized effective values across much of the ice-shelf domain. Large spatial variability in the optimized grain size is evident among East Antarctica, the Antarctic Peninsula, and West Antarctica. Notably, we find much larger grain sizes in East Antarctica and the Antarctic Peninsula, regions characterized by substantial melt while falling in the intermediate to low FAC range of ∼ 5–10 m. In contrast, the average grain size in ice shelf regions of West Antarctica is relatively small. Although dynamic near-surface processes such as meltwater refreezing can lead to localized grain growth (Veldhuijsen et al., 2024), the high accumulation rates typical of West Antarctic ice shelves counteract long-term grain growth, resulting in smaller mean grain sizes compared to East Antarctica and the Antarctic Peninsula.
In Fig. 3c, ice-saturated areas near the grounding line of the Amery Ice Shelf show IMAU-FDM grain-size estimates that are substantially higher than the ASCAT-conditioned optimized effective values, with differences of approximately 8 mm (highlighted in red). In contrast, a sharp transition is observed in Amery for the relatively dryer and colder regions towards the coast, where IMAU-FDM grain-size estimates are substantially lower than the ASCAT-conditioned optimized values. This observation is also made in Larsen-C ice shelf. For dry ice shelves, such as the Ross and Ronne Ice Shelves, the grain-size estimates from IMAU-FDM closely align with the ASCAT-conditioned optimized values, falling near the 1 : 1 line (Fig. 3d), although IMAU-FDM values are slightly higher in some locations. The refreezing of meltwater impacts the snow structure by increasing grain size; however, IMAU-FDM has a limited response to this effect. The model assumes quite a small refreezing grain size of 0.25 mm (van Dalum et al., 2022), primarily affecting only the top surface of the firn (Veldhuijsen et al., 2024).
In Fig. 3d, we observe an overall mean difference in grain size of −0.11 mm relative to the 1 : 1 line, with a standard deviation of 0.73 mm. This large standard deviation is due to substantial negative differences in depleted regions of the Larsen-C Ice Shelf and positive differences in depleted regions of the Amery Ice Shelf, where these points can be considered outliers that deviate markedly from the 1 : 1 line.
In order to understand these varying results, we relate the difference between IMAU-FDM modeled and optimized grain size for depleted regions with the ice-saturation of the firn layer, as in Fig. 4. It is evident that regions of the Amery Ice Shelf, where the entire firn column is ice-saturated from the near-surface (i.e., at a depth of < 2 m), show IMAU-FDM grain-size estimates that are substantially higher than the ASCAT-conditioned optimized effective values. This is indicated by large difference in grain size, i.e. 2–8 mm (refer to Fig. 3c). However, as this depth increases, the difference shifts toward negative values, indicating IMAU-FDM grain-size estimates that are lower than the ASCAT-conditioned optimized values, particularly in the Larsen-C region. Meanwhile, at the transition, several locations with intermediate ice-saturation depths (including Shackleton, Wilkins, George-VI, remnants of Larsen-B) and ice shelves in East Antarctica (e.g., Publications) exhibit well-matched grain sizes. Moreover, at deep saturation depths, most ice shelves (Larsen-B, George-VI, Wilkins) also remain close to the 1 : 1 line. The exception is a small cluster of five points on Larsen-C, where IMAU-FDM grain-size estimates are lower than the ASCAT-conditioned optimized values by several millimeters. These results highlight that the consistency between IMAU-FDM grain-size estimates and ASCAT-conditioned optimized values is strongly regime-dependent, particularly with respect to the degree of ice saturation and associated firn processes.
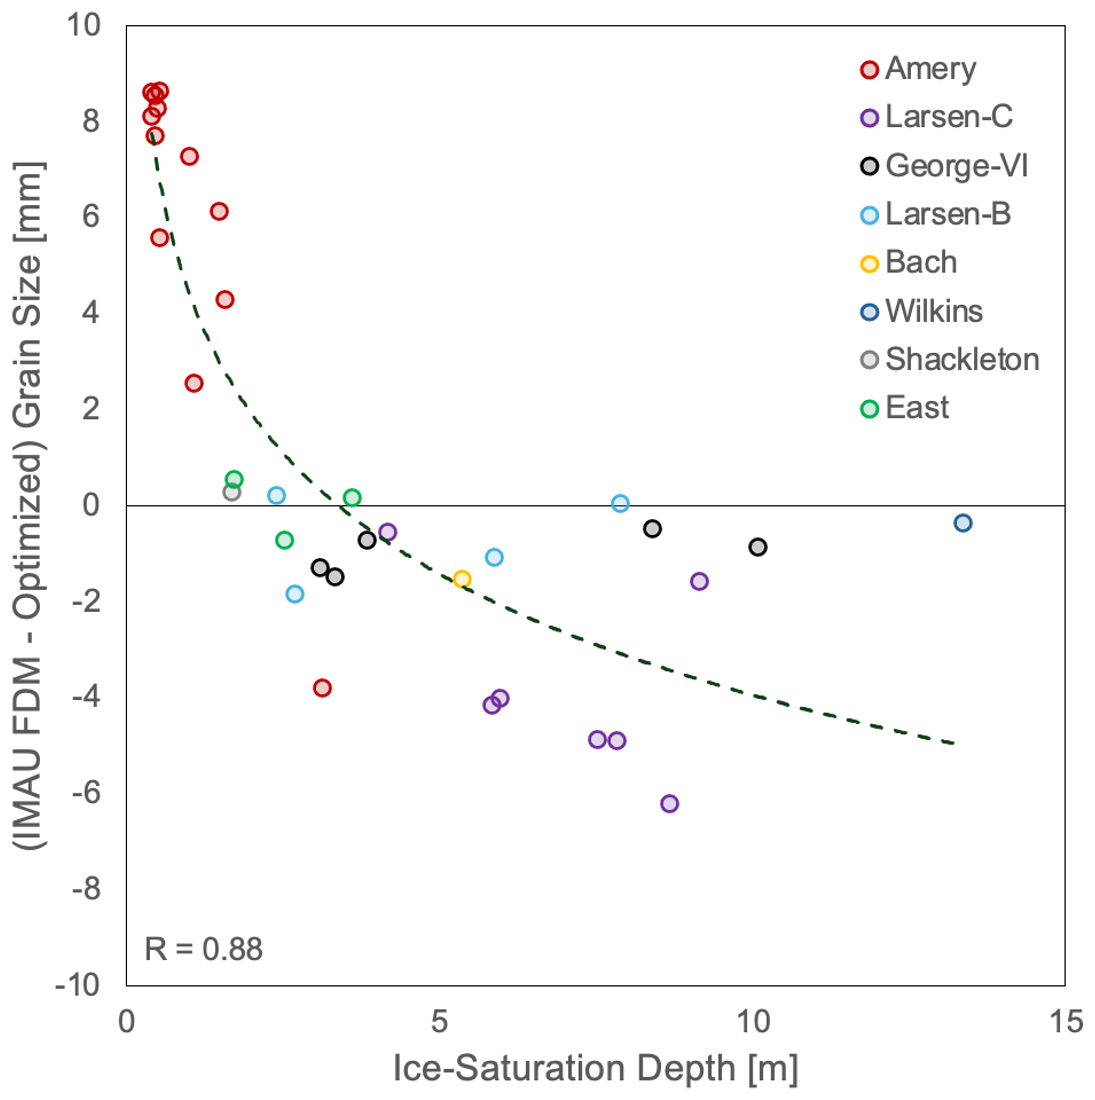
Figure 4Relationship between (IMAU-FDM minus Optimized) grain size and the depth after which the firn column becomes ice for depleted regions at the Antarctic-ice-shelf-wide scale. East consists of ice shelves in East Antarctica, i.e. Publications and two unnamed ice shelves. The black dashed line shows the best-fit curve and R is the Pearson correlation coefficient. Here, all the data points fall in depleted firn regime (FAC < 1.5 m).
4.4 Sensitivity of the effective grain-size retrieval to prescribed assumptions
The baseline inversion for the high-FAC Ross benchmark yields an optimized correlation length of 0.39 mm and a corresponding effective grain-size parameter of 0.48 mm. This long-term mean-profile retrieval is consistent with the long-term Ross value derived from the main annual inversion and with the close correspondence between IMAU-FDM and ASCAT-conditioned effective grain sizes in dry, high-FAC regions shown in Fig. 3d. It therefore provides a consistent baseline for quantifying how much the retrieval changes when selected prescribed assumptions are perturbed. All perturbation scenarios converged without reaching either optimization bound, and the simulated backscatter reproduced the prescribed target within the 0.01 dB acceptance criterion. Table 2 summarizes the principal perturbation categories, while the individual scenarios and optimization diagnostics are reported in Appendix Table C1.
Table 2Sensitivity of the effective grain-size retrieval for the high-FAC Ross benchmark. Changes are calculated relative to the baseline effective grain-size parameter of 0.48 mm.
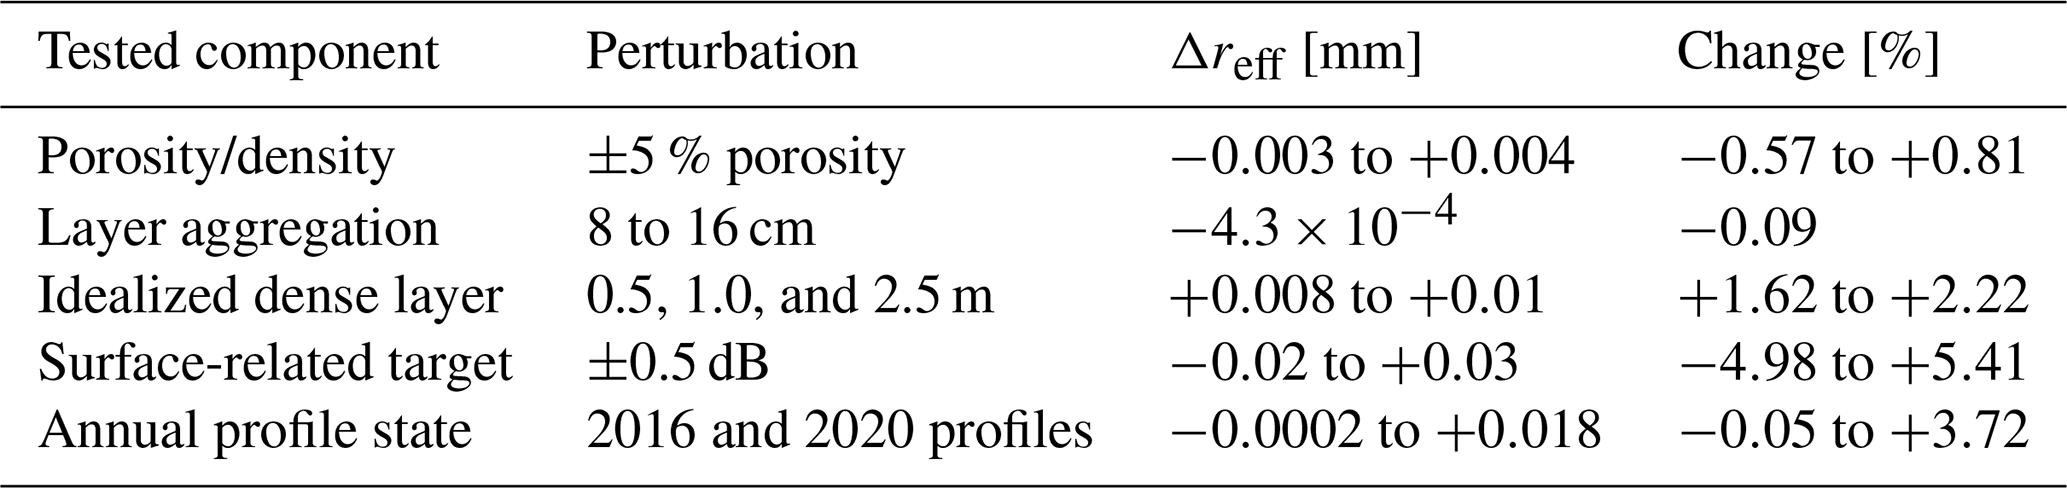
Among the primary perturbations, the prescribed ±0.5 dB surface-related target offsets produce the largest retrieval response, changing the effective grain-size parameter by −4.98 % to +5.41 %. Interannual full-profile variability produces changes of up to +3.72 %, while the idealized dense layers increase the retrieved parameter by 1.62 %–2.22 %. The dense-layer response decreases with depth, with the largest change obtained for the layer nearest 0.5 m and the smallest for the layer nearest 2.5 m. The ±5 % porosity perturbations change the retrieval by less than 1 %, and increasing the vertical aggregation from 8 to 16 cm produces a change of only −0.09 %.
The extended ±1.0 dB surface-related stress tests result in changes of −9.57 % and +11.33 %, respectively, and are reported separately from the primary sensitivity comparison. The primary perturbations therefore produce the following sensitivity hierarchy for the selected Ross benchmark: surface-related backscatter offsets, interannual full-profile variability, idealized dense layering, porosity, and vertical aggregation.
4.5 Variance partitioning of ASCAT backscatter with respect to FAC and grain size
Figure 5 summarizes the variance partitioning of interannual ASCAT backscatter within the adopted framework, showing the fractional contributions associated with grain size (GS), FAC, their interaction (FAC × GS), and the residual term as a function of mean FAC. This plot highlights the shifting importance of grain size and FAC across different FAC regimes (see Appendix Fig. B1 for the spatial distribution of the contributions).
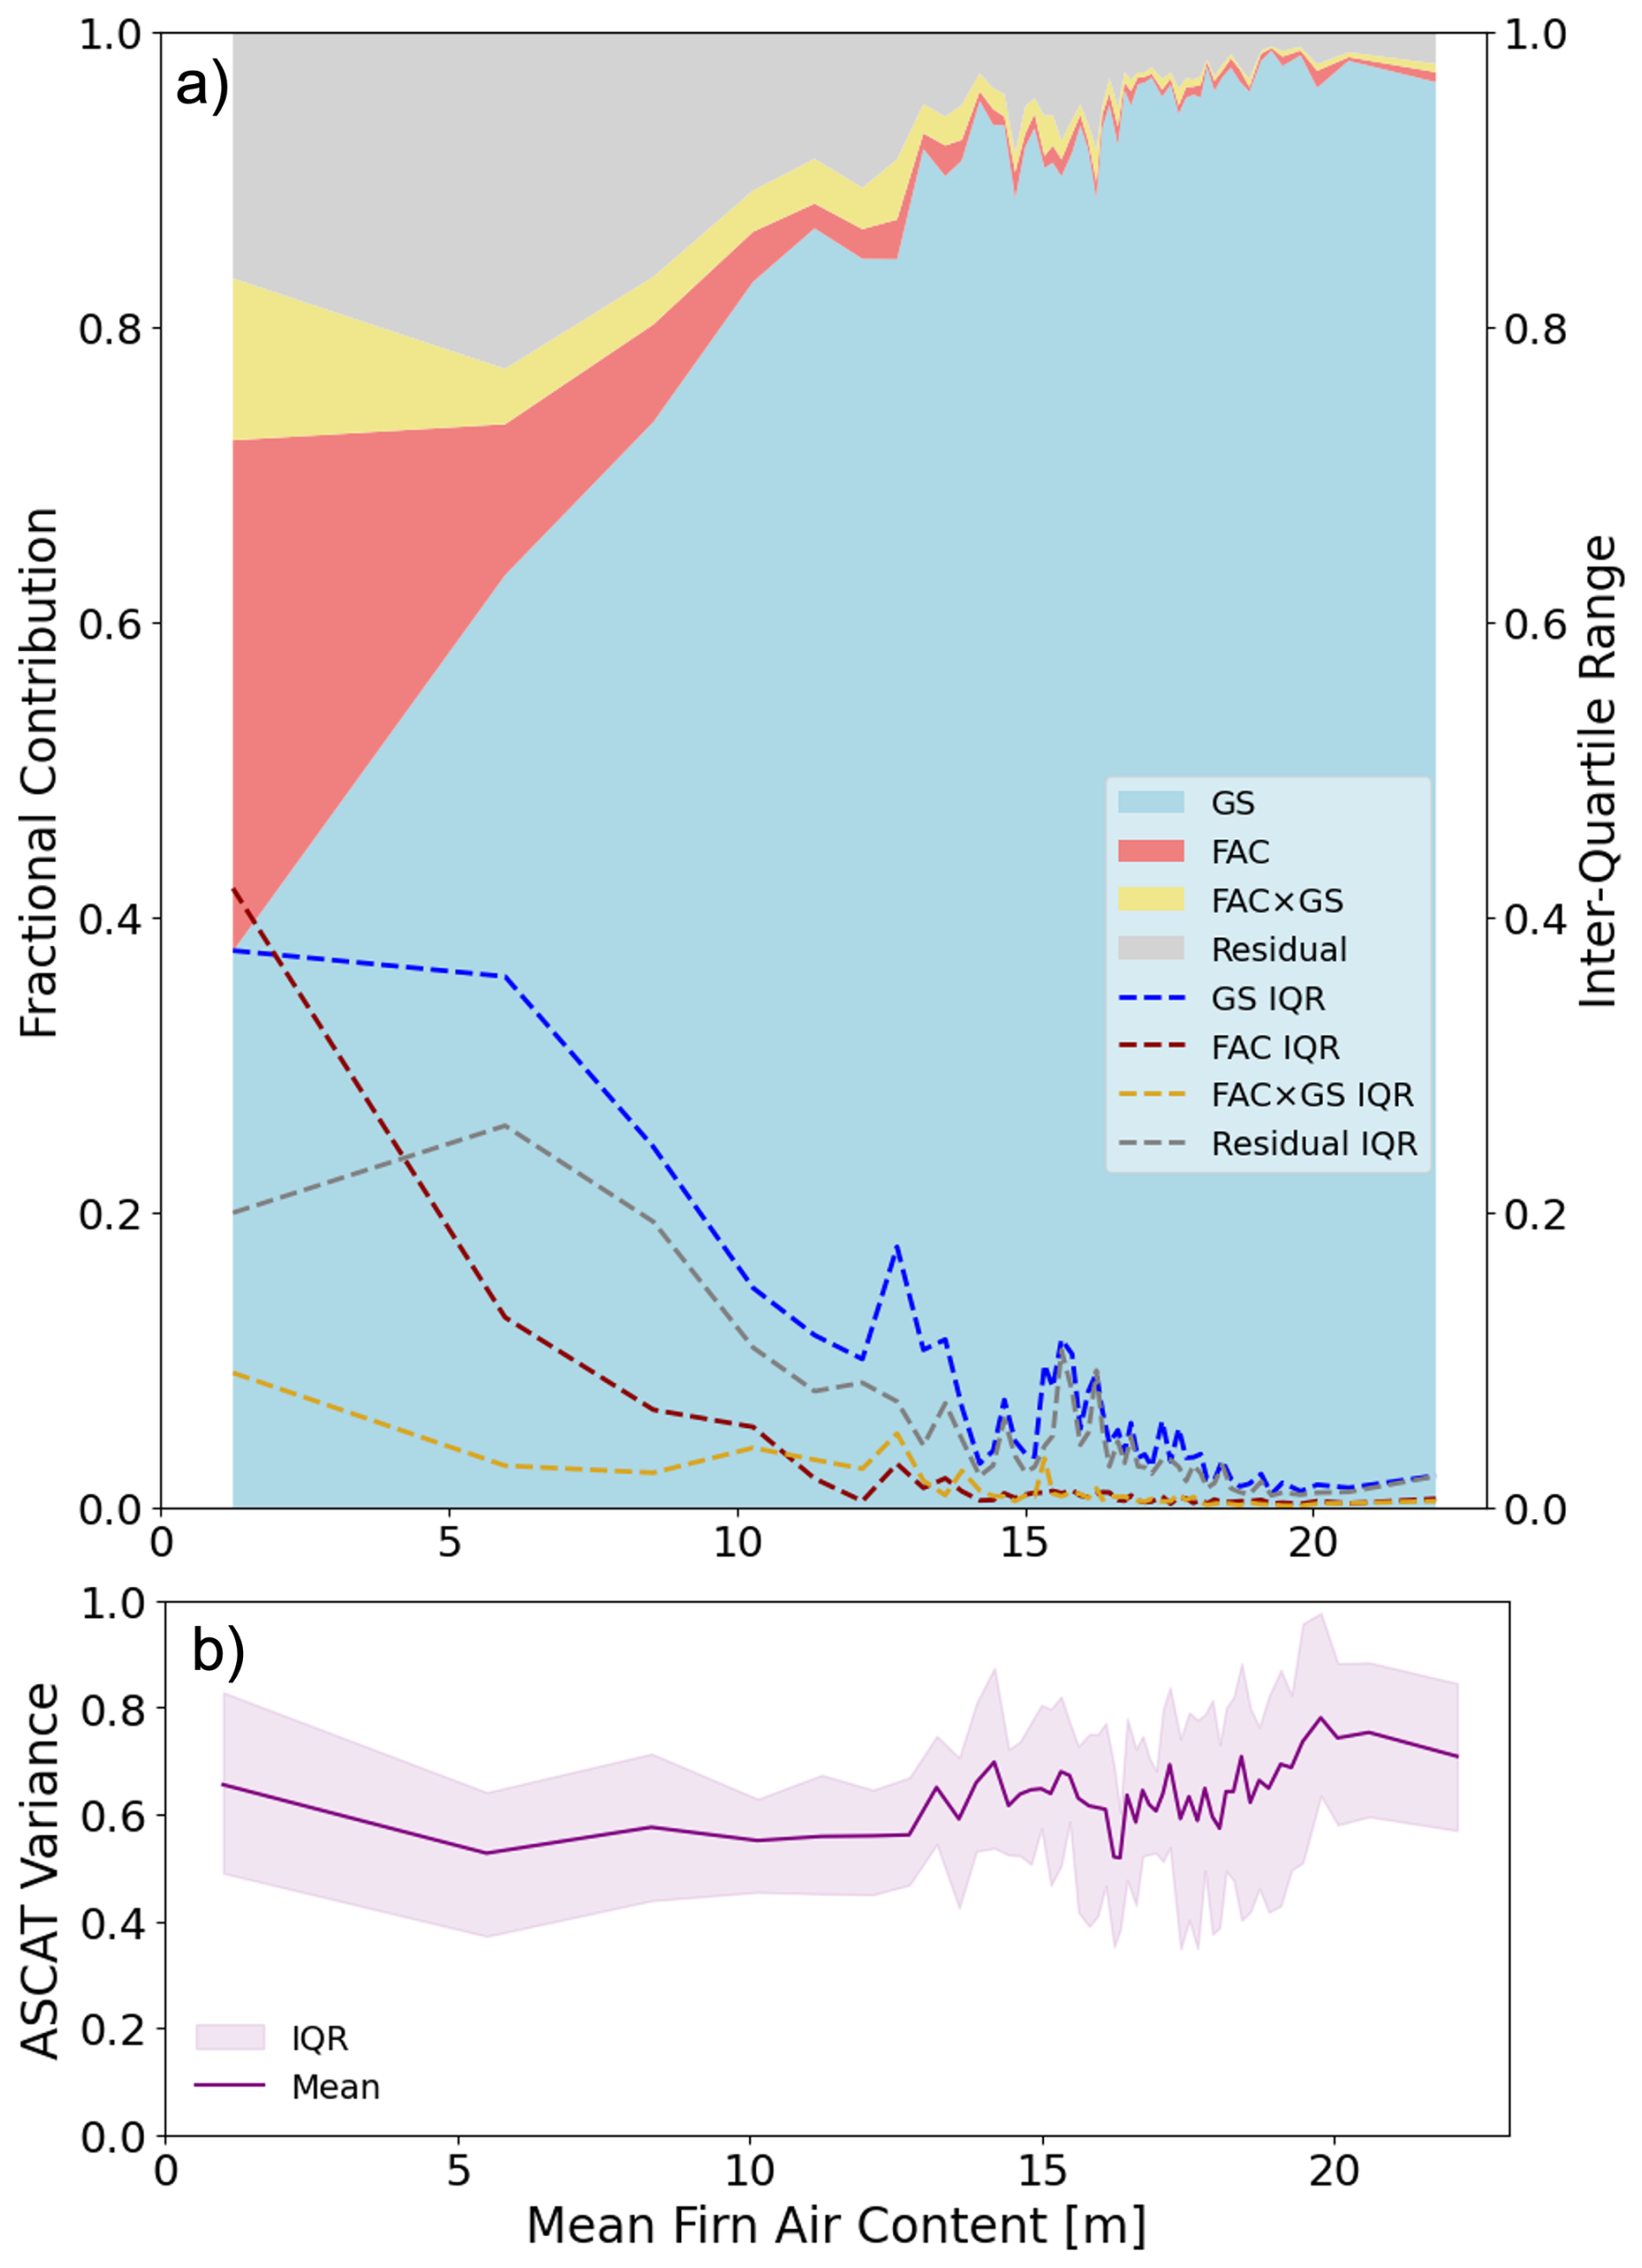
Figure 5(a) Fractional variance contributions to interannual ASCAT backscatter within the adopted framework, associated with grain size, FAC, their interaction (FAC × GS), and the residual component, with uncertainty represented by the IQR. (b) Mean ASCAT variance in dB as a function of mean FAC.
In regions with high FAC (e.g., > 10 m), the ASCAT signal is associated primarily with grain size within the adopted framework, with the blue fraction peaking and narrow IQR bands indicating relatively consistent behavior across cells (Fig. 5a). Here, the firn is more porous and is less frequently affected by melt-driven ice layers or saturation. These IQR trends also remain consistent for the residual contribution, suggesting that the larger fractional contributions associated with FAC and grain size are more consistently captured by the model in regions with FAC values > 10 m, leaving less residual variability.
As FAC falls below ≈ 10 m, the red FAC contribution rises sharply while the grain‐size fraction declines, marking the transition toward firn‐saturated conditions where density controls backscatter. The FAC × GS interaction term is consistently small relative to the main effects across FAC regimes, indicating that most of the partitioned variance is associated with the additive main effects of FAC and grain size rather than with their interaction. In low-FAC regions, the firn is highly heterogeneous due to processes such as temperature-driven metamorphism, refreezing, and ice saturation. These regions thus exhibit larger variability in the FAC- and grain-size-associated contributions to ASCAT backscatter, amplifying cell‐to‐cell scatter in each component's contribution (high IQR). Finally, when plotting the ASCAT variance in Fig. 5b, we find it is stable in high‐FAC regions but increases slightly in low‐FAC regions, reflecting heightened interannual backscatter variability under saturated firn. These aggregated curves show how the fractional contributions associated with grain size and FAC shift systematically with FAC.
4.6 Assessing FAC from ASCAT observations after grain size correction
Figure 6 presents the relationship between FDM-SMRT simulated ASCAT backscatter and IMAU-FDM winter mean FAC under two conditions: (a) with optimized grain size, and (b) with standardized grain size extracted from a power law fit on the FAC – optimized grain size relationship (see Appendix Fig. D1b). This comparison illustrates how grain-size variability affects the interpretability of the backscatter–FAC relationship.
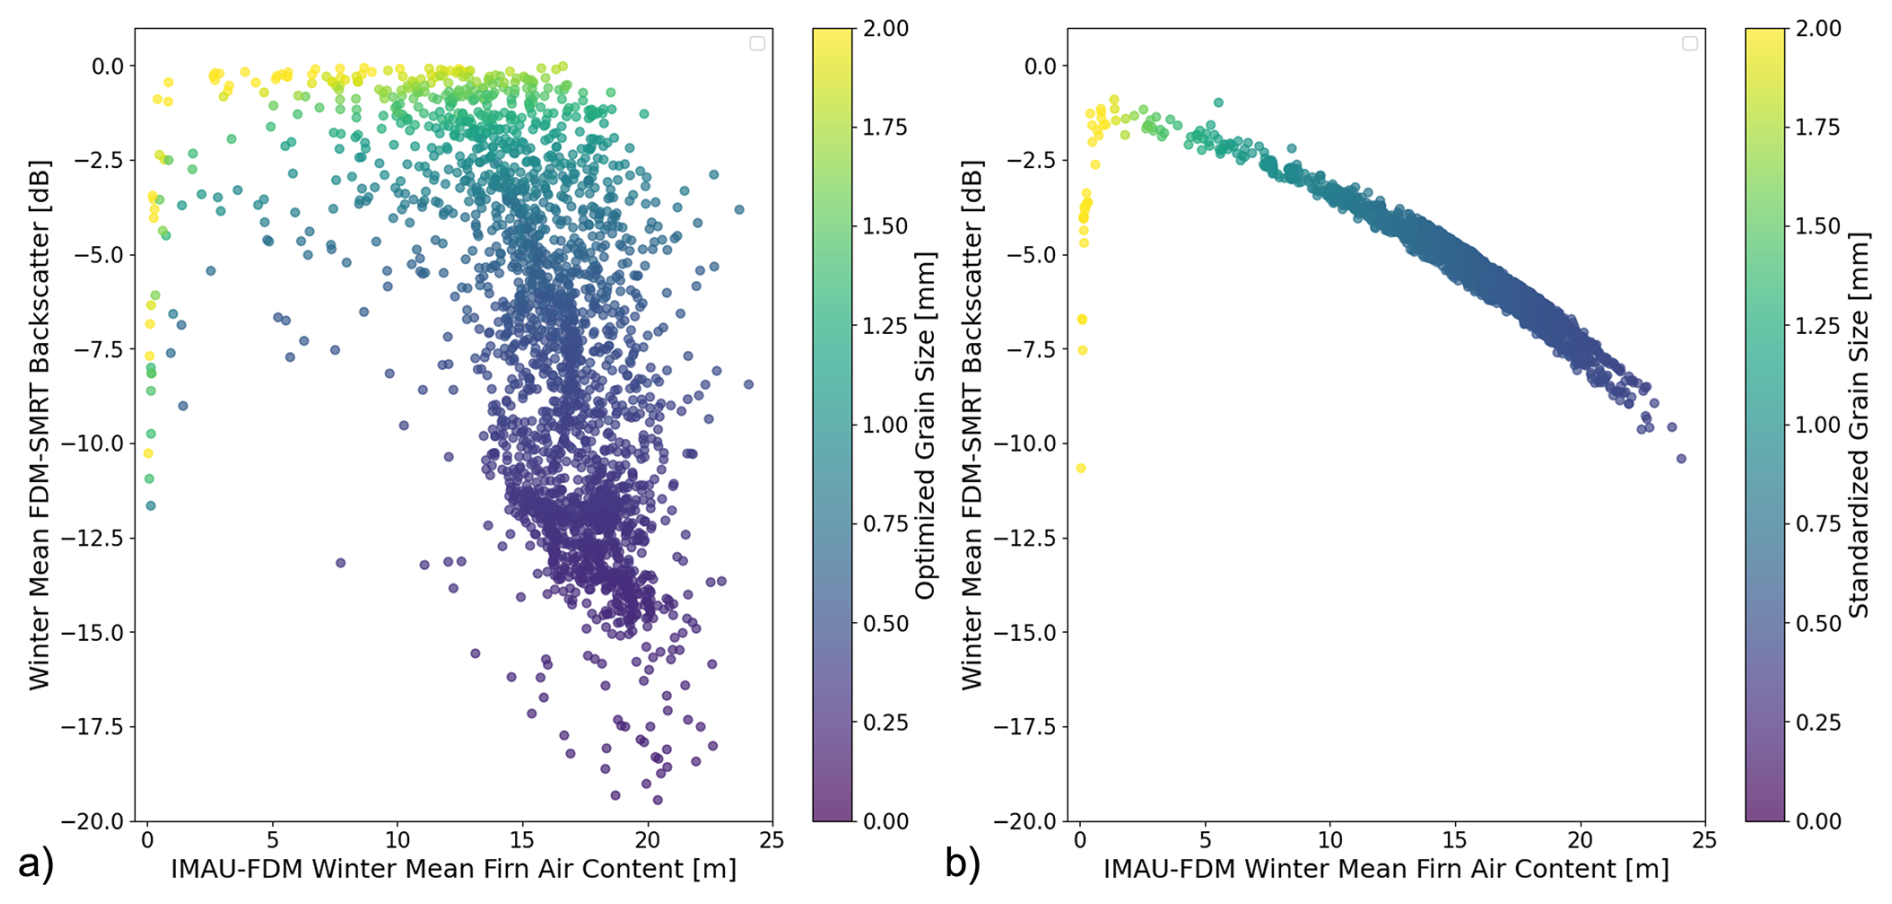
Figure 6(a) Inverted U-curve with grain size variations and (b) Adapted inverted U-curve without grain size variations at the Antarctic-ice-shelf-wide scale.
In Fig. 6a, where the grain size effect is included, we observe significant variability in the backscatter values for a given FAC. This variability confirms the influence of both FAC and grain size on backscatter (Alley et al., 2018; Picard et al., 2022b). In contrast, Fig. 6b, where the grain-size effect has been statistically standardized, shows a more coherent relationship between backscatter and FAC, resembling a smoother inverted U-curve. As already seen in Fig. 1, this adapted curve also indicates that backscatter is low in high-FAC (> 15 m) firn, rises linearly to a maximum near FAC ≈ 1.5 m, and then declines sharply for FAC < 1.5 m as the snowpack becomes depleted and dominated by dense ice layers. The key insight is that once the grain-size-driven scatter is reduced, the relationship between backscatter and FAC becomes more coherent and easier to interpret. This suggests that a substantial part of the spread in Fig. 6a is associated with grain-size variability, and that standardizing grain size makes the backscatter–FAC relationship more interpretable.
Our analysis demonstrates the comprehensive use of ASCAT observations to improve our understanding of firn properties, specifically grain size and FAC, on an Antarctic-ice-shelf-wide scale. Methodologically, we follow the same principle of coupling a firn model (IMAU-FDM) with a radiative transfer model (SMRT) to interpret microwave signals and optimize the grain size, as also explored by Dattler et al. (2024). However, our approach differs in scope and objective: (a) we use active C-band ASCAT backscatter, whereas Dattler et al. (2024) used passive AMSR-2 brightness temperatures for physics-based melt detection; and (b) we perform an ice-shelf-wide, per-pixel, per-year inversion to optimize grain size, whereas Dattler et al. (2024)'s study was limited to 13 sites and Larsen-C ice shelf. Our framework also differs from more empirical/observational ASCAT-based interpretations of firn state, such as the backscatter–melt relationships explored by Alley et al. (2018). The present study complements such approaches by explicitly treating grain-size variability within a physics-based FDM–SMRT framework before examining the backscatter–FAC relationship. The advantage of this approach is that it provides greater physical interpretability by identifying how grain-size-related variability affects ASCAT backscatter and FAC-oriented interpretation. The corresponding limitation is that the results depend more strongly on the adopted forward-model assumptions than an empirical/observational backscatter–FAC relationship. Thus, the main advance is not simply confirming that ASCAT is sensitive to both grain size and FAC, but showing how a physics-based inversion can constrain grain-size-related variability and thereby support more interpretable FAC-oriented analyses across Antarctic ice shelves.
Beyond these differences, our study brings three contributions. First, it delivers a scaled-up, ASCAT-constrained grain-size product with ice-shelf-wide coverage and annual cadence. Second, we apply variance-partitioning ANOVA to quantify how interannual backscatter variability is apportioned between grain size and FAC and to diagnose residual structure. Because the optimized grain size is itself inferred from ASCAT through the FDM-SMRT inversion, these post-optimization analyses are interpreted as conditional diagnostics within the adopted framework rather than as independent confirmation of process attribution. Third, by standardizing grain size, we derive an adapted backscatter–FAC relation indicating how FAC could be assessed from ASCAT, offering a potential pathway for large-scale firn monitoring. To support these results, we combine targeted 1-D and 2-D forward-sensitivity experiments, which delineate where ASCAT is microstructure- versus ice-saturation-dominated, with a controlled perturbation analysis that quantifies the local sensitivity of the retrieval to selected prescribed profile and forward-model assumptions.
Turning to the spatial patterns that emerge from this framework, we find broad agreement between IMAU-FDM grain size and the ASCAT-conditioned optimized effective parameter in high-FAC regions, where both indicate relatively small grain sizes (approximately < 0.5 mm). These small values are qualitatively plausible for cold, dry firn with limited melt influence and slower metamorphic evolution, although they should not be interpreted as independently validated grain-size benchmarks. Larger discrepancies emerge in intermediate- to low-FAC regions, where the IMAU-FDM grain-size estimates are often lower than the optimized effective values, while strongly depleted parts of the Amery Ice Shelf show the opposite behaviour. These differences should not be interpreted as direct evidence that the optimized retrieval represents physical truth or that IMAU-FDM errors arise solely from grain-size physics. Rather, they indicate framework-dependent differences between modeled firn-state/scattering behaviour and the ASCAT-conditioned effective parameter within the adopted FDM–SMRT framework. Such differences may arise from the IMAU-FDM grain-size parameterization, which could affect the simulated scattering response.
Two mechanisms are particularly relevant in melt-affected and depleted firn: (a) the minimal effect of refreezing on grain size in IMAU-FDM and (b) a lack of calibration in depleted conditions. The grain growth model used in IMAU-FDM assumes that refreezing impacts grain size only if grain sizes are below 0.25 mm (Veldhuijsen et al., 2024). Consequently, for refrozen layers where the grain size exceeds 0.25 mm, the effect of refreezing on grain size becomes absent. Physically, meltwater refreezing can form ice lenses and melt-refreeze crusts with a coarser effective microstructure than dry-snow grains. The 0.25 mm threshold in IMAU-FDM is therefore not a physical upper limit on grain growth, but a simplifying parameterization that limits refreezing-driven coarsening once grains exceed this value. This parameterization may contribute to cases where IMAU-FDM grain-size estimates are lower than the ASCAT-conditioned optimized effective values (Fig. 3c), particularly in melt-affected regions such as Larsen-C. This suggests that refrozen layers may produce an ASCAT scattering response consistent with a coarser effective microstructure than represented by the IMAU-FDM grain-size parameterization. By contrast, strongly depleted firn on the Amery Ice Shelf shows the opposite discrepancy, with IMAU-FDM grain-size estimates substantially higher than the ASCAT-conditioned optimized effective values.
One possible contributor to these contrasting discrepancies is the age of the firn-ice transition, which refers to the time it takes for firn to transform into glacial ice at a given location depending on factors such as accumulation rates, surface temperature, and densification processes (Veldhuijsen et al., 2023). In regions with an older firn-ice transition, such as the Amery Ice Shelf (1–1.5 kyr), the grains continue to grow indefinitely over time in the model based on temperature, as there is no prescribed maximum grain size in IMAU-FDM (Veldhuijsen et al., 2024). This can lead to very large modeled grains, contributing to the large positive discrepancy between IMAU-FDM and the ASCAT-conditioned optimized effective values (Fig. 4d of Veldhuijsen et al., 2023). However, the absence of an upper bound applies to the IMAU-FDM parameterization and does not imply that the ASCAT-conditioned optimized parameter can grow freely in the same way, because the inversion is constrained by the observed ASCAT backscatter and the FDM–SMRT forward-model sensitivity. Overall, this suggests that the IMAU-FDM grain-size parameterization may be poorly constrained in old, depleted firn such as Amery, where ice saturation begins near the surface (Veldhuijsen et al., 2023), or that uncertainties in the modeled firn-ice transition age may contribute to the discrepancy. In contrast, at the Larsen-C Ice Shelf, where the firn-ice transition is much younger (0.05–0.1 kyr), the limited time available for temperature-driven grain metamorphism yields inherently smaller modeled grains, resulting in IMAU-FDM grain-size estimates that are lower than the ASCAT-conditioned optimized values. Additional calibration data from depleted regions would therefore be needed to assess the physical plausibility of both the modeled grain-size evolution and the ASCAT-conditioned optimized effective parameter in these regimes.
Direct in-situ validation of grain size at the spatial support and vertical sensitivity of ASCAT is limited. Accordingly, the present results should be interpreted primarily as an internally consistent, ASCAT-conditioned effective parameterization rather than as a comprehensively validated external grain-size retrieval. In addition, IMAU-FDM has been evaluated primarily against available in-situ firn observations from Antarctica that are concentrated in non-melt (dry-snow) regions; model performance and calibration are best constrained under dry-snow conditions (Veldhuijsen et al., 2024). Consistent with this, we find that in predominantly dry-snow ice-shelf regions (e.g., Ross and Filchner-Ronne), the ASCAT-conditioned effective grain size closely matches the IMAU-FDM grain-size estimates (Fig. 3d), providing an internal consistency check in regimes where the model is best constrained. Where limited field observations are available, we additionally compared our retrieved effective grain size to in-situ grain-size measurements reported at sites D5 and D17, in the vicinity of the French station of Dumont d'Urville in Adélie Land, East Antarctica, for austral summers 2017–2021 (Arioli et al., 2023). Both sites fall within a single 27 km IMAU-FDM grid cell used in our analysis. For that cell, the mean IMAU-FDM grain size is 1 mm and the mean ASCAT-conditioned grain size is 0.56 mm, while the reported in-situ mean grain sizes are 0.55 mm (D5) and 0.43 mm (D17). Given the mismatch in seasonality (summer sampling versus our winter JJA means) and spatial scales (point measurements versus a 27 km grid-cell effective value), we treat this comparison as a plausibility check rather than a strict validation. Nevertheless, the retrieved estimate is closer to the in-situ magnitude than the unadjusted IMAU-FDM value, suggesting that the inversion moves the effective grain size toward field-observed values.
The close correspondence in dry, high-FAC firn also provides the appropriate context for the Ross perturbation experiment. At this site, the ASCAT response retains clear microstructural leverage (Fig. 2b–c), the ASCAT-conditioned effective grain size is consistent with the IMAU-FDM estimate (Fig. 3d), and the long-term perturbation baseline agrees with the main annual retrieval. The experiment therefore addresses a specific robustness question: when the retrieval is ASCAT-constrained and internally consistent within a comparatively favourable firn regime, how strongly does it shift when selected structural and full-profile assumptions are perturbed?
The resulting hierarchy indicates that the Ross retrieval is comparatively insensitive to moderate changes in porosity and vertical discretization, whereas dense layering and interannual changes in the complete prescribed firn state have greater influence. This suggests that the dry-firn agreement is not primarily an artefact of the adopted 8 cm aggregation or of modest changes in the prescribed density profile. At the same time, the stronger response to surface-related target offsets shows that unrepresented near-surface scattering remains an important source of retrieval sensitivity, even in this comparatively favourable regime.
This sensitivity hierarchy is physically consistent with previous microwave studies showing that the simulated response depends jointly on microstructure, density, and vertical layering (Brucker et al., 2010; Picard et al., 2018, 2022a; Amory et al., 2024). The moderate response to the idealized dense layers supports the importance of stratigraphy, while also showing that the insertion of a single thin dense layer does not dominate the retrieved column-integrated parameter in the selected dry-firn profile. More importantly, the leading surface-related sensitivity agrees with ASCAT studies showing that wind-organized surface structure, sastrugi, roughness, and snow-transport processes can modify backscatter independently of the volume microstructure represented in the present SMRT configuration (Fraser et al., 2016; Poizat et al., 2024; Shukla et al., 2024). The response to the annual profiles further demonstrates that the retrieval inherits variability from the prescribed FDM state, including concurrent changes in temperature, density, liquid water content, and their vertical distributions. These results strengthen the internal robustness of the retrieval to moderate density and discretization choices in the selected dry-firn setting, but they do not provide independent validation or a domain-wide uncertainty estimate. In particular, the hierarchy should not be transferred directly to depleted firn, where the forward experiments show weaker grain-size identifiability and the Antarctic-wide comparison shows larger model-retrieval differences.
In regions with significant depletion near the grounding line of the Antarctic Peninsula, the Amery ice shelf, and blue ice areas of the Baudouin and Nivlisen ice shelves, our optimized grain size map shows larger grains. The spatial patterns observed in our study align strongly with the vulnerable regions identified across the Antarctic ice shelves in previous studies (van Wessem et al., 2023; Alley et al., 2018). These vulnerable regions have been characterized based on either analyzing how much warming is required for a particular ice shelf to reach the MoA limit of 0.7 (van Wessem et al., 2023) or understanding the link between melt days and ASCAT backscatter (Alley et al., 2018). As the ASCAT record continues to lengthen, our study provides a tool to monitor long-term changes in firn properties, particularly through optimized grain size. Such tools are essential for assessing the degree of ice-saturation in the firn and identifying regions susceptible to potential meltwater ponding, which are precursors to structural weakening and hydrofracture (Kuipers Munneke et al., 2014).
By exploiting the relationship between FAC and optimized grain size, our adapted inverted U-curve demonstrates the potential of using ASCAT backscatter to inform FAC inferences once grain-size effects are controlled (Fig. 6). At present, we regard this as an indicative proof of concept rather than an operational FAC retrieval curve. It remains conditioned on the adopted FDM-SMRT framework, the statistical standardization of grain size, and the assumptions used to distinguish firn regimes. Additional validation and treatment of ambiguities would be required before such a relationship could be used for standalone FAC retrieval. Converting observed backscatter to FAC will require (a) a rigorously validated calibration from observed to standardized backscatter, (b) explicit handling of the two-branch ambiguity at low returns with independent priors, and (c) representation of surface-scattering processes in dry, high-FAC regimes.
For step (a), a calibration step is required because the adapted curve is defined in the standardized backscatter domain, whereas ASCAT provides observed backscatter that still contains grain-size, surface roughness, and other scene-dependent influences. For step (b), where the mapping is locally monotonic, the FAC estimate is single-valued and direct. At low observed backscatter, however, the inverted-U shape yields two plausible states: a depleted, low-FAC branch and a dry, high-FAC branch. Independent priors are therefore mainly required in this low-backscatter regime, whereas the intermediate, locally monotonic part of the curve is less ambiguous. Such priors could include melt-pond presence from optical imagery (van Wessem et al., 2023), melt-day information from ASCAT or climate-model analyses (de Roda Husman et al., 2024), MoA climatology (van Wessem et al., 2023), field-based grain size where available (Arioli et al., 2023), or guidance from firn models (Veldhuijsen et al., 2024). However, these constraints are not uniformly or consistently available across the Antarctic domain, and their absence limits the use of the adapted curve as a standalone FAC retrieval. Once the depleted- versus dry-side branch is independently identified, FAC can be read consistently from the adapted curve. For step (c), unmodeled surface processes (roughness, snowdrift, accumulation variability) can shift ASCAT independently of grain size or FAC; we briefly flag the issue here and treat it in detail under Limitations below. These steps are beyond the scope of this study, but our results outline how such an assessment could be developed and evaluated.
The FAC-oriented interpretation developed here is also specific to C-band ASCAT and should not be assumed to transfer directly to other microwave frequencies. The relative sensitivity of backscatter to grain size, density, and FAC depends on frequency-dependent penetration depth and scattering behaviour. The C-band sensitivity pattern shown in Fig. 2b–c therefore reflects the ASCAT-specific balance between grain-size-related volume scattering and density/FAC-related saturation effects, and this balance should not be assumed to transfer directly to other microwave frequencies. Extending the framework with multi-frequency observations would therefore be an important direction for testing whether the grain-size and FAC sensitivities identified here are consistent across different penetration depths and scattering regimes.
Methodological scope and future development
The scope of the optimized grain-size retrieval depends on the firn regime, the sensitivity of C-band backscatter, and the assumptions embedded in the FDM–SMRT framework. We therefore first summarize the regimes in which the retrieval is relatively more or less informative before discussing the main methodological constraints and future developments. Confidence in the retrieval is highest where the sensitivity experiments indicate sufficient grain-size leverage, particularly where the σ0–r response remains on the steep part of the curve and where the 2-D response surface is steep in grain size relative to density/FAC (Fig. 2b–c). This includes many dry-snow and intermediate-FAC regions for which the optimized grain size remains physically consistent with the adopted FDM–SMRT framework. Confidence is lower in shallow-slope (“plateau”) regimes, particularly in strongly depleted firn, where Fig. 2b–c shows that the C-band response becomes less sensitive to grain size and more strongly governed by density/FAC. In addition, some dry, high-FAC regions exhibit elevated residual variability, indicating that unmodeled near-surface processes such as roughness, snowdrift, and accumulation variability may also influence ASCAT backscatter. Taken together, these considerations indicate that the optimized grain size is best interpreted as a regime-dependent effective parameter, while the FAC-related interpretation should be viewed as a proof of concept for future retrieval development rather than as a standalone operational product.
With this context in mind, we do not provide formal posterior uncertainty estimates for the optimized grain size. Instead, retrieval robustness and interpretive confidence are assessed from the forward sensitivity experiments, the Ross one-at-a-time perturbation analysis, the regime dependence of grain size identifiability, the residual ANOVA fraction, and the limited plausibility checks against available field observations. A first consideration concerns identifiability of grain size in the shallow-slope (“plateau”) regime of the backscatter response (Fig. 2b–c). As shown by our sensitivity analysis, once the σ0–r curve flattens (small ), ASCAT provides limited leverage to refine grain size from a single C-band observation. This flattening occurs (i) at very large grains and (ii) in depleted firn (FAC ∼ 0), where the 2-D response surface becomes nearly flat in r and comparatively steeper in ρ, indicating that changes in backscatter are governed more by density/FAC than by microstructure in this regime. The Amery case demonstrates the plateau regime but cannot be taken as representative of all such settings; broader sampling is needed. Accordingly, we avoid generalizing beyond the observed range and emphasize FAC interpretations where the response to r is weak. Future extensions that add frequency or incidence-angle diversity (or additional plateau-regime sites) should help tighten r constraints where the C-band response is flat.
A second consideration is variance attribution after inversion. By construction, the optimized grain size is obtained by fitting FDM-SMRT coupled simulations to ASCAT observations year by year; it is therefore expected that post-optimization ANOVA shifts variance from FAC or the residual to ropt where the response is steep in r (Fig. 2). Our 2-D sensitivity surface supports this interpretation: at intermediate densities the surface is steep in grain size and comparatively flat in density, so interannual ASCAT variability should project primarily onto r, precisely where ANOVA assigns a larger fraction to ropt. Conversely, at low- and high-density extremes (very high or very low FAC) the surface flattens in r and steepens in ρ, implying that variability should project more onto FAC; ANOVA indeed shows higher FAC contributions in the low-FAC regime. At the very high-FAC end, however, some dry shelves exhibit elevated residual variability, which may be consistent with unmodeled surface-process controls (e.g., roughness, snowdrift, accumulation variability) that can modulate ASCAT independently of r or FAC (Fraser et al., 2016). In short, the variance reallocation after inversion follows the forward-model sensitivity, while the residual in dry, high-FAC zones may indicate unrepresented near-surface processes.
The ANOVA-based variance partitioning should nevertheless be interpreted as a first-order statistical diagnostic rather than as a complete physical decomposition of the firn–microwave system. Because it assumes approximately additive contributions from FAC, grain size, their interaction, and a residual term, strongly non-additive behavior may not be fully captured. Such behavior could occur when grain size and FAC co-evolve during melt–refreezing transitions (Veldhuijsen et al., 2024), when ice saturation causes threshold-like scattering changes (Brucker et al., 2010), or when layering and near-surface structure make the sensitivity to one variable depend on the state of another (Amory et al., 2024). Therefore, the variance fractions should not be interpreted as uniquely separable physical controls, and the small interaction term should not be taken as proof that aliasing between FAC and grain size is absent. Some degree of confounding may remain when FAC and grain size co-vary, particularly during melt–refreezing transitions (Veldhuijsen et al., 2024), and the partitioning should therefore be interpreted within the sampled interannual variability and the adopted inversion framework.
The residual contribution in dry, high-FAC regimes may partly reflect surface processes rather than microstructure or FAC alone. The Ross perturbation experiment supports the potential importance of this source, because the prescribed surface-related target offsets produced the largest response among the primary perturbations (i.e. changing the effective grain-size parameter by −4.9 % to +5.4 %). This experiment does not attribute the response to a particular physical mechanism, because surface roughness, sastrugi, snowdrift, and accumulation variability are not represented explicitly or constrained independently. Rather, it quantifies the retrieval sensitivity to their potential combined contribution to the ASCAT backscatter. Independent constraints on these processes would be needed to determine their individual importance. Such constraints could include in-situ roughness surveys (Shukla et al., 2024), azimuthal-anisotropy proxies for sastrugi and microtopography (Cartwright et al., 2022), or snow-transport diagnostics (Poizat et al., 2024). These observations could be combined with an explicit rough-surface scattering representation in SMRT (Picard et al., 2018) to evaluate whether accounting for surface scattering reduces the residual contribution and improves retrieval robustness in dry, high-FAC regimes.
A related methodological constraint of our approach is the assumption of a constant grain size across all layers up to 20 m depth during optimization. This approach is adopted to avoid an under-represented inversion problem, because a vertically resolved retrieval would require estimating a large number of unknowns, including grain size and density/FAC for each layer, from a limited ASCAT backscatter observation space. Similar challenges have also caused optimizer collapse in previous multi-layer retrieval attempts (Charrois et al., 2016; Cluzet et al., 2020). By simplifying the optimization to a single representative grain size, we obtain a stable and consistent estimate across Antarctic ice shelves, allowing broad spatial patterns and regime-dependent contrasts to be assessed.
This simplification, however, has important physical implications. A single column-wide grain-size parameter cannot represent vertical heterogeneity in firn microstructure, including near-surface metamorphic gradients, buried refrozen layers, ice lenses, or depth-dependent grain growth associated with firn densification and melt–refreeze events. The optimized grain size should therefore be interpreted as an ASCAT-conditioned effective parameter within the adopted FDM–SMRT framework, rather than as a depth-resolved physical grain-size profile. Its value is likely weighted toward the parts of the upper firn column that contribute most strongly to C-band volume scattering, because the scattering physics depend on the interaction between microwave frequency, grain size, density, temperature, and layer structure. Consequently, we place greatest confidence in the large-scale, footprint-scale spatial patterns, particularly where the forward sensitivity analysis indicates stronger identifiability, while avoiding interpretation of the retrieval as local or vertically resolved grain-size truth.
This limitation is consistent with previous work showing that grain size can vary significantly with depth and that such vertical variability affects microwave scattering and absorption, especially from layers with larger grains (Brucker et al., 2010). Accounting for depth-dependent grain size could therefore refine the representation of firn microstructure in radiative transfer models. However, even simple depth-varying alternatives, such as prescribing an exponential grain-size profile, would remain underconstrained with the present single-frequency ASCAT setup unless additional assumptions or external constraints were introduced. Relaxing this limitation would therefore require expanding the observation space, for example through multi-sensor, multi-frequency, and multi-angular constraints. This could include combining ASCAT with passive microwave observations such as AMSR-2 or SMOS, SAR observations such as Sentinel-1, and, in future, lower-frequency missions such as ROSE-L, NISAR, and BIOMASS, which may provide complementary sensitivity to deeper firn layers. Such datasets could support future joint inversion frameworks across frequency and incidence angle to better constrain vertical grain-size heterogeneity. Advanced optimization approaches, such as Bayesian optimization (Pan et al., 2017) or genetic algorithms (Tedesco and Kim, 2006), may also help explore depth-varying parameterizations more efficiently, but would still require sufficient observational constraints to avoid non-unique solutions.
A related spatial consideration is that the inversion is performed at the 27 km RACMO/IMAU-FDM grid scale, so the retrieved quantity should also be interpreted as a spatially averaged, footprint-scale effective parameter. Different parts of a single ASCAT footprint may span different firn regimes, especially near transitions among dry, intermediate, and depleted firn. Such sub-footprint regime mixing can make the single grain-size assumption less representative of local variability, although we do not explicitly quantify this effect here. Broader microwave snow and firn studies show that heterogeneity in grain size, density, stratigraphy, anisotropy, and near-surface structure can influence microwave scattering and its interpretation (Leinss et al., 2016; Tsang et al., 2022; Shukla et al., 2024). Future work could test the importance of footprint-scale mixing by applying the framework to higher-resolution active microwave C-band observations, such as Sentinel-1, and comparing the resulting effective parameters with those retrieved from ASCAT.
Finally, the present framework should be interpreted as diagnostic rather than prognostic. It is suited to interpreting present firn-state variability, identifying regimes where ASCAT provides stronger or weaker constraints on grain size, and supporting FAC-oriented interpretation once grain-size-driven scatter is reduced. It does not by itself predict future firn evolution or the response of firn conditions to future climate perturbations. Such prognostic applications would require additional development, including stronger external validation, explicit coupling to firn-evolution modelling, and treatment of the unresolved processes and ambiguities discussed above.
A further practical consideration is the computational cost of the present implementation. The current inversion was designed as a research-scale framework to test the physical consistency and interpretability of ASCAT-constrained grain-size retrievals across Antarctic ice shelves, rather than as an operationally deployable monitoring system. Although the workflow is feasible on high-performance computing infrastructure, routine large-scale or near-real-time application would require additional methodological development. Possible routes include reduced-order formulations, pre-computed lookup tables, surrogate or emulator-based forward models, or selective regional and temporal updating focused on regimes where ASCAT provides the strongest retrieval leverage. Thus, the present results demonstrate research-scale feasibility, while operational deployment would require further optimization of the inversion framework.
In the future, improved spatial resolution surface mass balance (SMB) products from RACMO at 2 km (Noël et al., 2023) could be utilized to simulate firn profiles from IMAU-FDM with enhanced resolution. This would be invaluable for our analysis, allowing for a more detailed understanding of changes in firn properties based on ASCAT observations. Ultimately, we envision the potential use of optimized grain size by the firn modeling community to constrain grain size parameters in their models. This could be achieved by integrating optimized grain sizes into the model parameterization process, thereby improving the representation of refreezing, snow compaction, and metamorphism processes that directly influence grain size.
In this study, we used ASCAT observations within an FDM–SMRT framework to infer an effective grain-size parameter and to explore, as a proof of concept, how FAC-related firn states may be interpreted once grain-size effects are reduced. We present a new ASCAT-constrained grain-size retrieval parameter, inferred by minimizing the mismatch between FDM–SMRT coupled simulations and ASCAT observations. Our findings reveal significant spatial variability in the optimized effective grain-size parameter relative to IMAU-FDM grain-size estimates. In regions with a dry snowpack, the optimized values closely align with IMAU-FDM estimates. However, as FAC decreases, larger framework-dependent discrepancies emerge. In many intermediate- to low-FAC regions, IMAU-FDM grain-size estimates are lower than the ASCAT-conditioned optimized values, whereas in strongly depleted parts of the Amery Ice Shelf, IMAU-FDM estimates are substantially higher. These discrepancies may be linked to the degree of ice saturation within the firn column. For example, in depleted regions of the Amery Ice Shelf, where the firn column becomes ice-saturated from near-surface depths, the large IMAU-FDM grain-size estimates may reflect the absence of a prescribed upper bound on grain growth over long firn–ice transition ages. Conversely, in regions such as Larsen-C, where the depth of complete ice saturation is greater, IMAU-FDM grain-size estimates are lower than the ASCAT-conditioned optimized values; this may partly reflect the refreezing scheme in the model, which limits additional refreezing-driven grain growth once grain sizes exceed 0.25 mm. Within the adopted framework, we find that C-band backscatter is most sensitive to grain size in several firn regimes, and that the backscatter–FAC relationship becomes more interpretable once grain-size effects are reduced. This provides a proof of concept for how ASCAT observations could contribute to FAC-oriented firn monitoring once grain-size effects are accounted for. Moreover, by assessing the individual contribution of grain size and FAC to ASCAT variance, we find that dry ice shelves, such as Ross and Filchner–Ronne, show enhanced sensitivity of backscatter to grain-size variations, whereas backscatter variability is more strongly associated with FAC variations in depleted ice-shelf regions such as Amery, George-VI, and Larsen-C. The optimized grain size should therefore be interpreted as an effective, ASCAT-conditioned parameter whose confidence is regime-dependent and whose independent validation remains limited. In this regard, our findings suggest that ASCAT observations provide a complementary diagnostic and monitoring metric for shifts in firn conditions that are relevant to the stability of Antarctic ice shelves. Furthermore, our study opens new avenues for improving firn model parameterization and for using ASCAT observations to better diagnose the state of the firn layer.
Figure A1 shows the performance of FDM-SMRT coupling upon optimization, when compared with the ASCAT observations for all the points at the Antarctic-ice-shelf-wide scale.
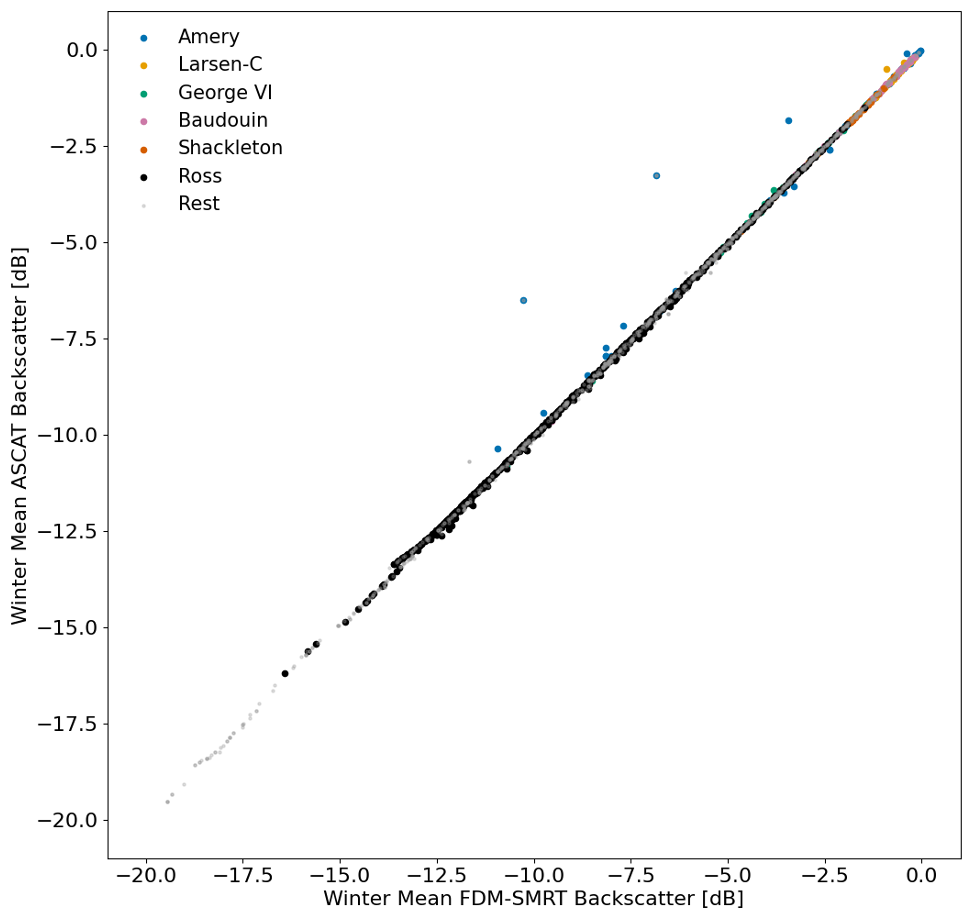
Figure A1Absolute comparison of backscatter between winter mean FDM-SMRT coupled simulation and winter mean ASCAT observations after optimization. Pearson correlation coefficient (R-value) is 0.99 and Root Mean Squared Error (RMSE) is 0.18 dB. Note that this agreement reflects internal consistency within the adopted framework, not independent validation.
Figure B1 presents a side-by-side comparison of the ANOVA-based variance partitioning of ASCAT backscatter within the adopted framework, using the IMAU-FDM modeled grain size (Fig. B1a–d) versus the optimized grain size (Fig. B1e–h).
In Fig. B1a, the fractional variance contribution associated with rFDM shows a spatially heterogeneous pattern, with certain regions in West Antarctica exhibiting moderate contributions. By contrast, Fig. B1e shows that after optimization, grain size (rOpt) is associated with a much larger fractional contribution to ASCAT backscatter variability, especially across the dry ice shelf regions of West Antarctica and the East Antarctica, and portions of the Antarctic Peninsula. These regions fall into the intermediate- to high-FAC regime (i.e., ≈ 12–25 m FAC in Fig. 1b, representing the right side of the inverted U-curve), where the optimized grain-size term contributes more consistently to the partitioned ASCAT variability within the adopted framework.
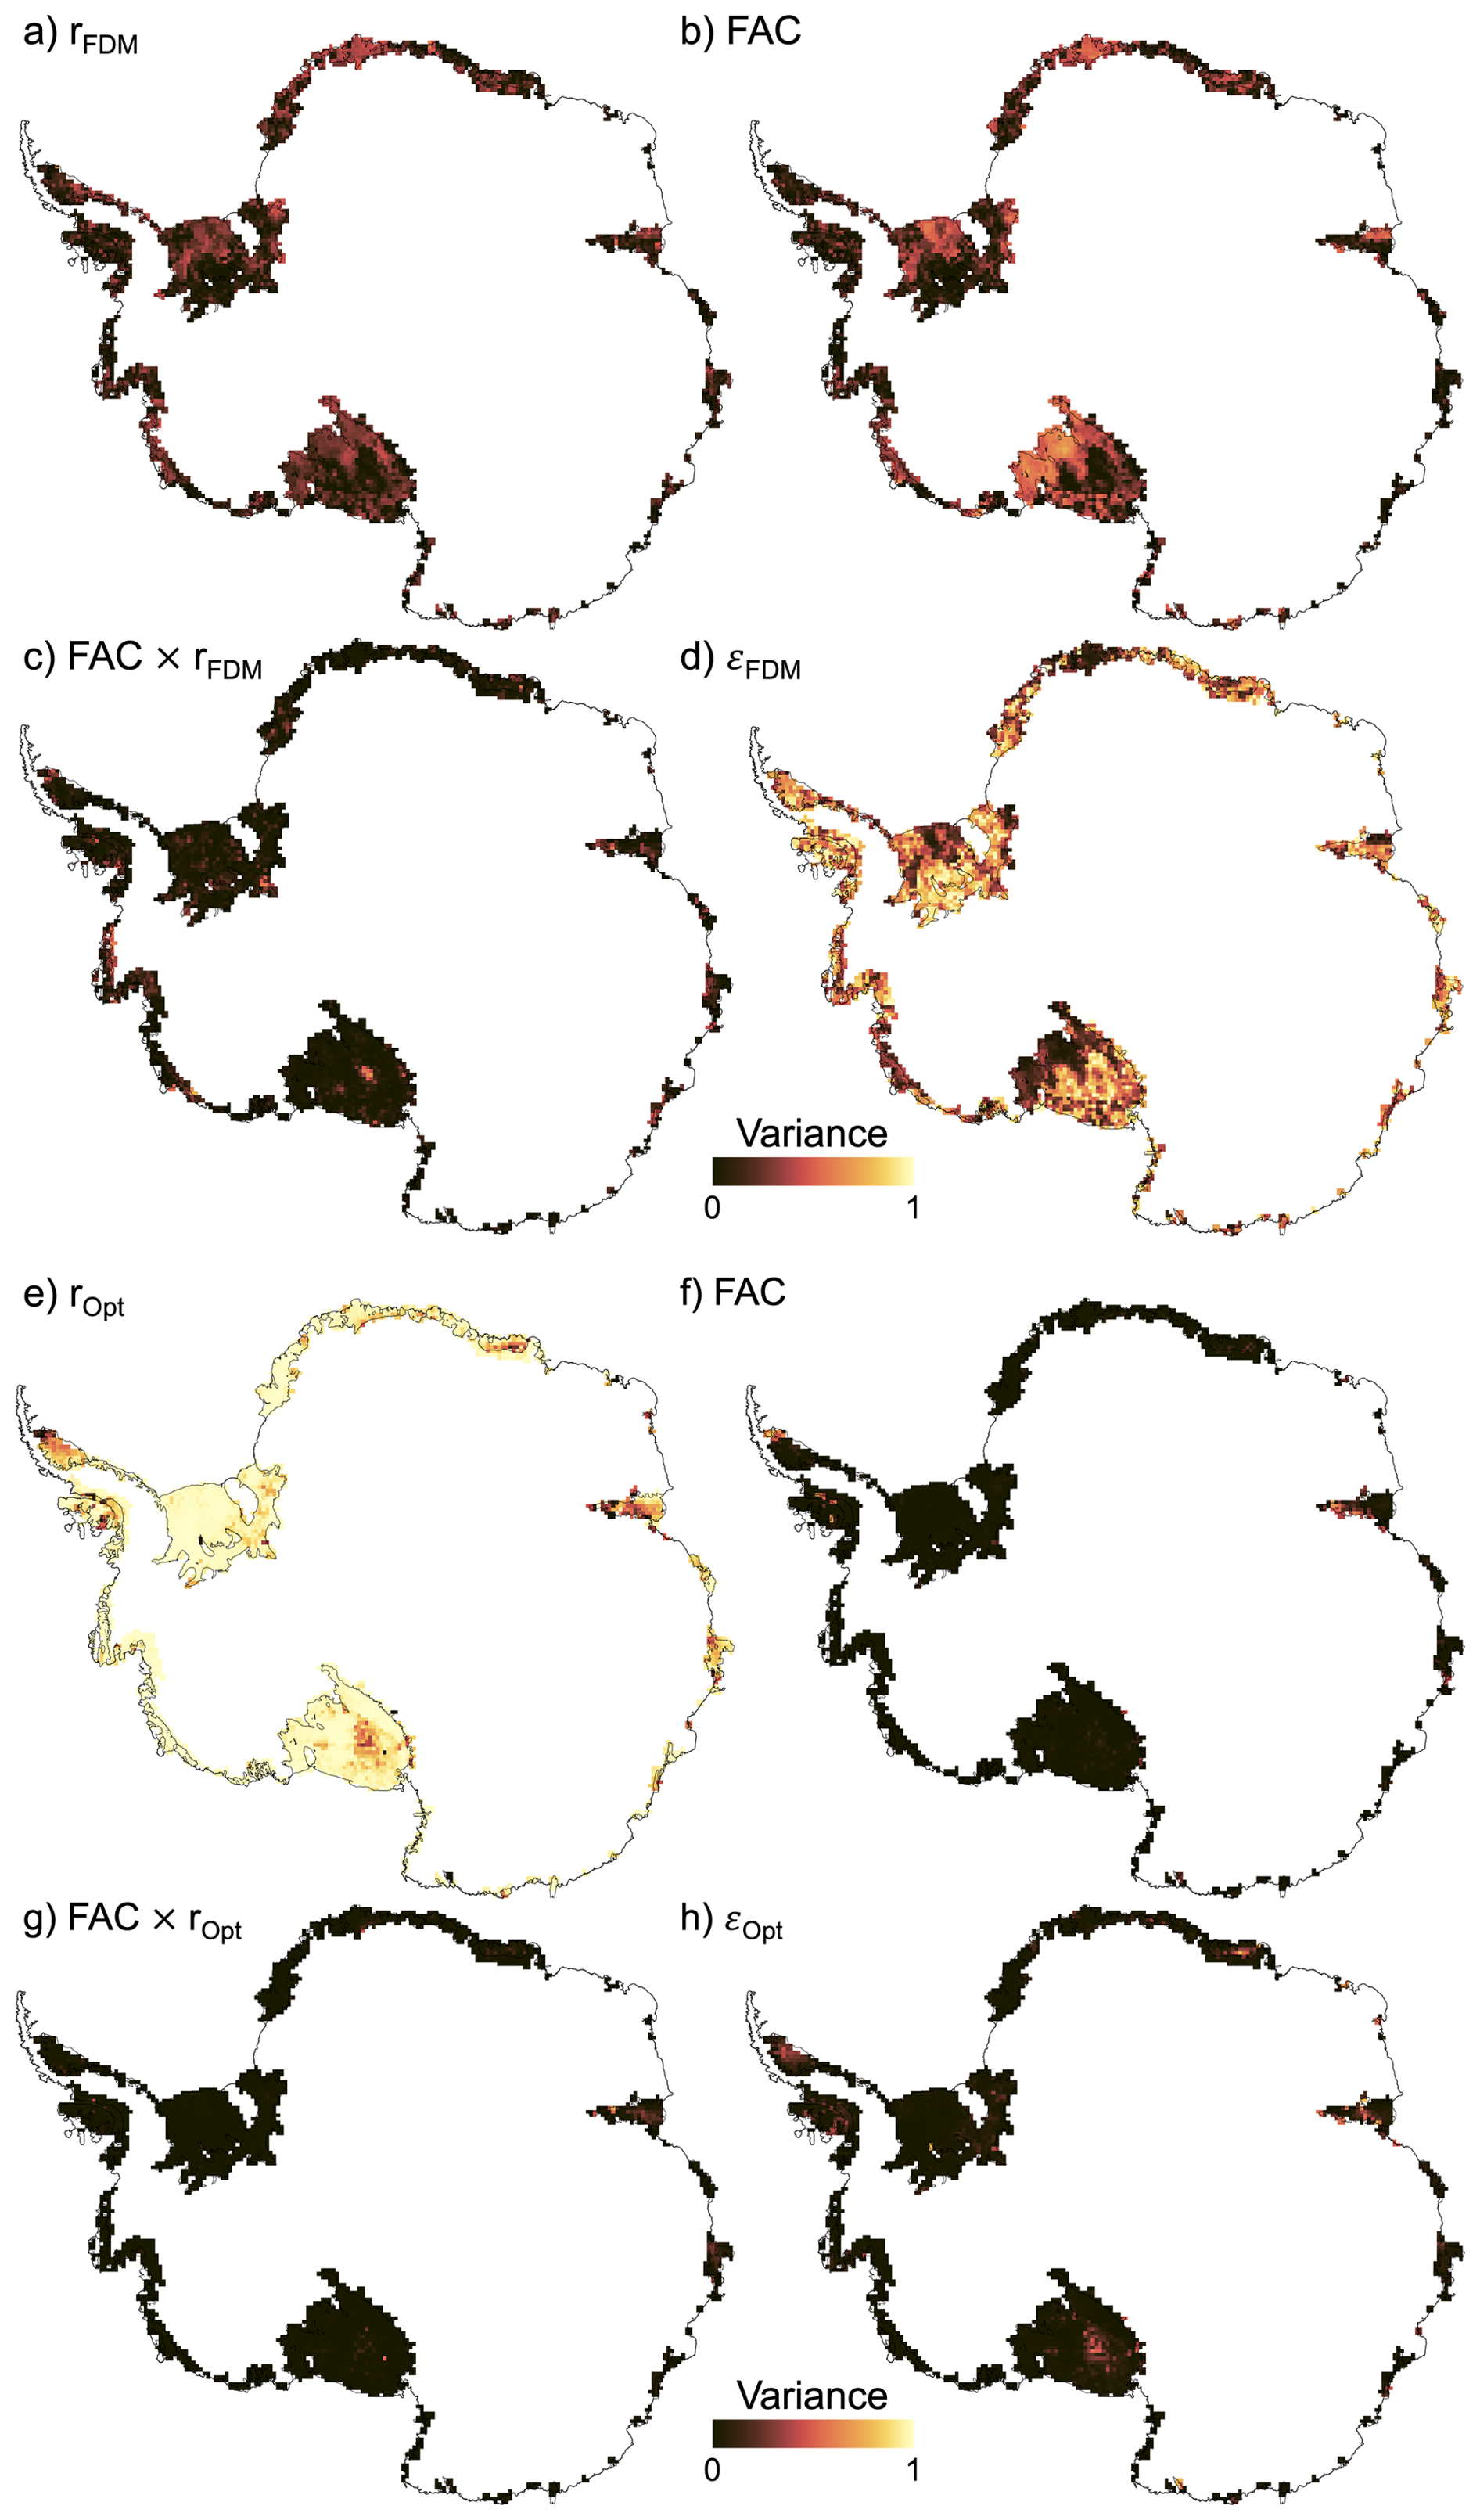
Figure B1Spatial distribution of fractional variance contributions to interannual ASCAT backscatter within the adopted framework, associated with FAC, grain size (r) and their interaction, before and after grain–size optimization. Panels (a)–(d) show ANOVA using IMAU-FDM model grain size (rFDM): (a) contribution of rFDM, (b) of FAC, (c) their shared FAC × rFDM term, and (d) residual variance contribution (εFDM). Panels (e)–(h) show the same decomposition after replacing rFDM with our ASCAT-optimized grain size (rOpt): (e) rOpt, (f) FAC, (g) FAC × rOpt, and (h) residual variance contribution (εOpt).
By construction, part of this increase is expected, because rOpt is obtained by fitting SMRT to ASCAT year by year, so variance that previously projected onto FAC or the residual is reallocated to rOpt where backscatter is grain-size sensitive. Beyond this, a plausible physical contributor in dry-snow regimes is episodic refreezing that enlarges grains (Veldhuijsen et al., 2024). This unidirectional increase in grain size can still cause noticeable interannual changes in backscatter (Picard et al., 2022b; Fraser et al., 2016), as regions with smaller initial grains experience more pronounced growth compared to regions where grains are already large and relatively less influenced by refreezing (Veldhuijsen et al., 2024).
Figure B1b highlights the fractional variance contribution associated with FAC, which is concentrated over specific regions, such as parts of the Ross and Filchner-Ronne ice shelves but remains generally low across the ice shelves. After optimization, the relative FAC contribution to backscatter variability (Fig. B1f) falls well below its pre-optimization levels. This drop occurs because the optimized grain-size term is associated with a larger share of the partitioned variability that previously projected onto FAC when modeled grain sizes were used. However, depleted firn regions near the grounding line of Amery, Larsen-B, and George-VI ice shelves still exhibit relatively large FAC-associated contributions. This indicates that regions on the left side of the inverted U-curve display enhanced sensitivity of ASCAT backscatter to FAC variations. From a physical perspective, we expect depleted regions to have larger grains where the density approaches that of glacial ice. This thus limits further grain growth and results in almost no scattering interfaces for the incoming radar signal. In such cases, changes in grain size have a negligible effect on backscatter, as also demonstrated in Fig. 2. Figure B1c shows the shared fractional variance contribution associated with FAC and rFDM, indicating only limited interaction between the two, especially in regions of West Antarctic ice shelves. In Fig. B1g, this shared contribution decreases further after optimization, particularly in localized regions where firn processes are more dynamic, such as near the grounding lines of ice shelves and in areas of higher surface activity.
The most striking result is shown in Fig. B1d, where the residual variance contribution is large across much of the Antarctic ice shelves. This indicates that, prior to optimization, the partitioned contributions associated with grain size, FAC, and their interactions remain small relative to the residual term. In Fig. B1h, however, the residual contribution is substantially reduced after optimization. Although relatively large residual contributions persist in isolated parts of the Antarctic Peninsula, Ross, and Roi Baudouin ice shelves, the overall reduction suggests that grain-size optimization captures a larger share of the partitioned ASCAT variability within the adopted framework.
Table C1 presents the individual one-at-a-time perturbation results underlying the category-level sensitivity ranges reported in Table 2.
Table C1Detailed one-at-a-time perturbation results for the high-FAC Ross Ice Shelf benchmark. The optimized correlation length lc, effective grain-size parameter reff, and its change relative to the baseline are reported for each scenario. The ±1.0 dB surface-related cases are extended stress tests and are not included in the primary sensitivity ranking. All scenarios converged successfully, none reached either optimization bound, and all absolute target–simulation residuals were below 0.01 dB.
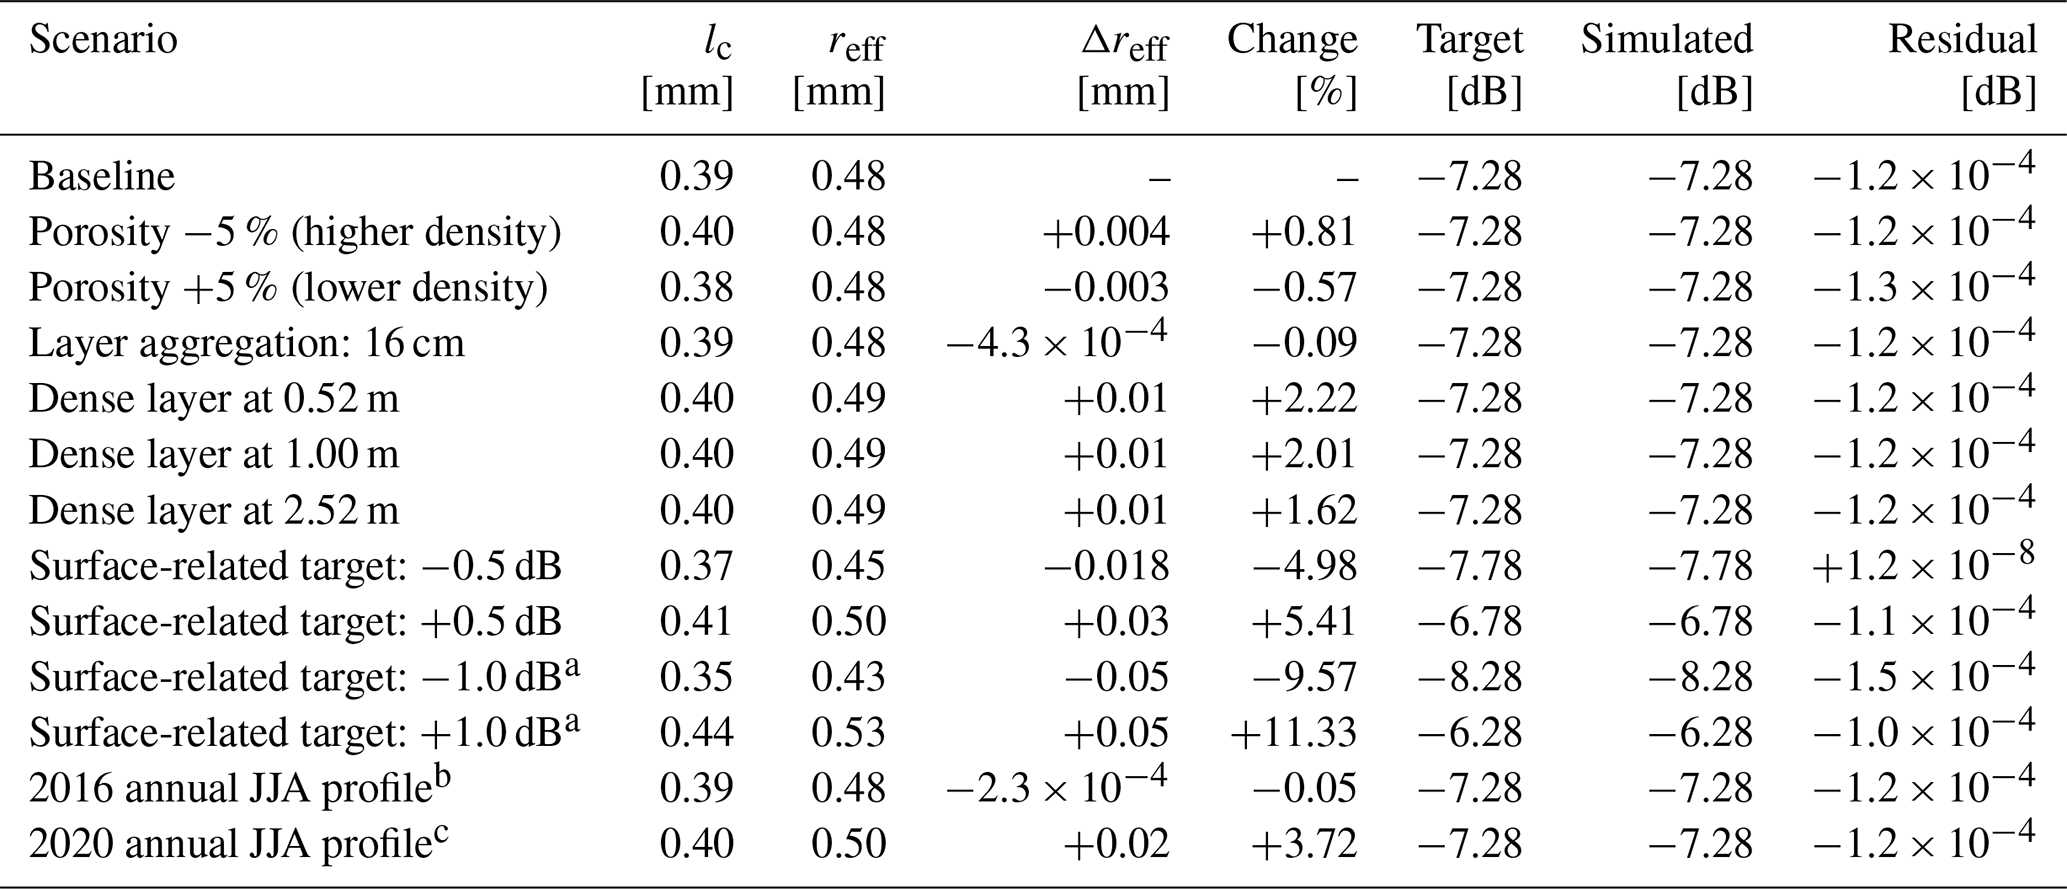
a Extended stress test, excluded from the primary sensitivity ranking. For the idealized dense-layer experiments, one horizontally continuous 8 cm layer was assigned a density of 900 kg m−3. The actual layer-centre depths were 0.52, 1.00, and 2.52 m, and the corresponding baseline densities were 402.6, 416.8, and 431.5 kg m−3, respectively. b Annual JJA profile with the minimum vertically averaged profile temperature in the 2007–2021 IMAU-FDM record (242.1 K). c Annual JJA profile with the maximum vertically averaged profile temperature in the record (243.5 K).
Before assessing the FAC directly from ASCAT backscatter, we compared the spatial variability in IMAU-FDM winter mean grain size and optimized grain size as a function of IMAU-FDM winter mean FAC, as in Fig. D1. In regions with high FAC (> 20 m), the optimized grain size remains low and closely aligns with IMAU-FDM grain size. This likely reflects limited melt in these areas, which typically maintain a dry snowpack that is well represented by IMAU-FDM. At intermediate FAC (5–20 m), IMAU-FDM generally predicts smaller grain sizes, while the optimized estimates show a wider spread. For ice shelves experiencing episodic melt within this range, enhanced refreezing and metamorphism can yield coarser effective microstructure, which IMAU-FDM's fixed 0.25 mm refreeze-grain-size parameterization (and its limited representation of repeated melt–refreeze cycles) may not fully capture (Veldhuijsen et al., 2024). In strongly depleted firn (FAC < 5 m), grain size often increases substantially in both the optimized and modeled cases, consistent with dense, refrozen firn and ice-saturated conditions.
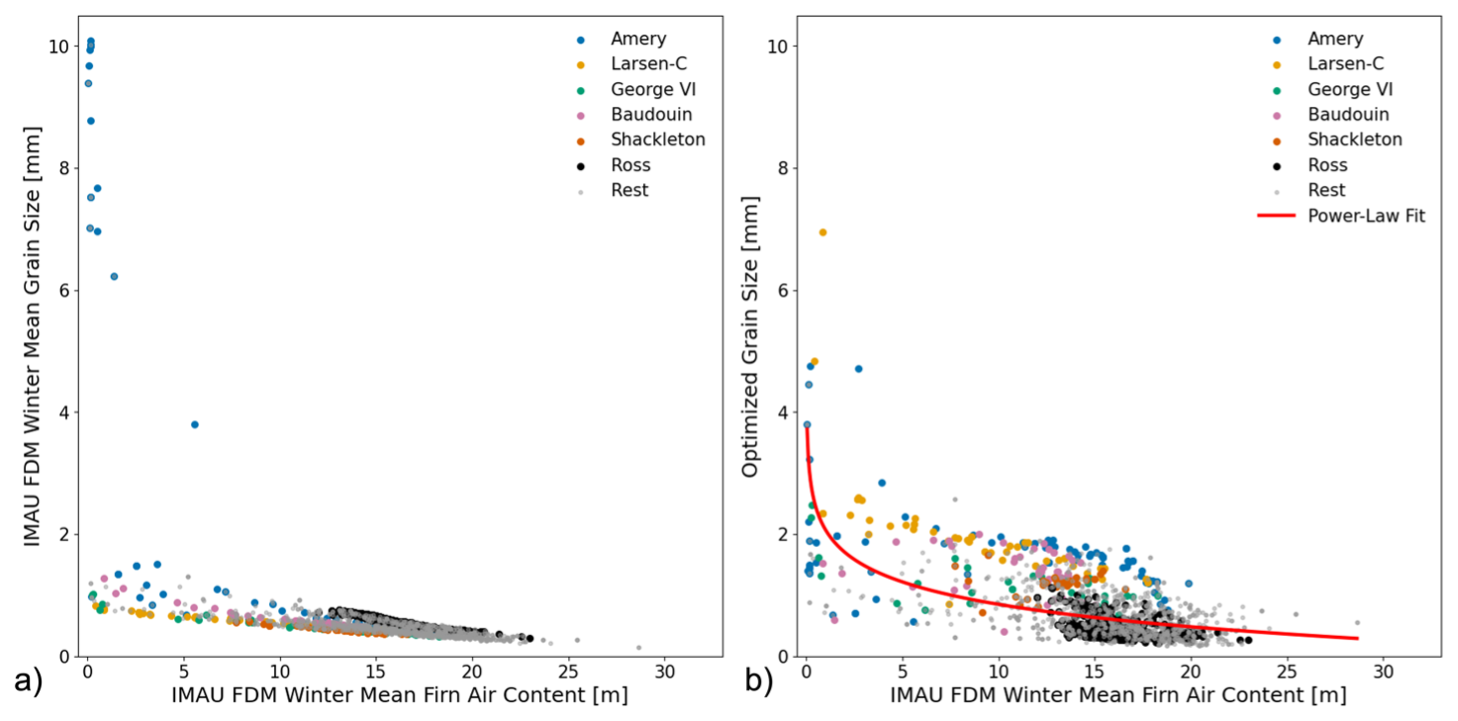
Figure D1Antarctic-ice-shelf-wide relationship between IMAU-FDM winter mean FAC and (a) IMAU-FDM winter mean grain size, (b) Optimized grain size (power law fit represented by red line). “Rest” represents the data points of all other ice shelves except the ones mentioned in color.
The C-band ASCAT data are available from the BYU Scatterometer Climate Record Pathfinder (https://www.scp.byu.edu/data/Ascat/SIR/Ascat_sir.html, last access: 28 July 2026; Long et al., 1993). The Sentinel-2 melt pond volume dataset is available on Zenodo (https://doi.org/10.5281/zenodo.7334047; van Wessem et al., 2022). The code of IMAU-FDM v1.2AD is available on Zenodo (https://doi.org/10.5281/zenodo.10723570; Veldhuijsen, 2024). The analysis and inversion code, processed model inputs, optimized effective grain-size dataset, perturbation-analysis outputs, and figure-ready data required to reproduce the main results are archived on Zenodo as “Code and data for Inferring Effective Firn Grain Size across Antarctic Ice Shelves from ASCAT Observations”, version 1.0 (https://doi.org/10.5281/zenodo.21499624, Shukla et al., 2026). The archived release is permanently versioned and corresponds to the manuscript version submitted for review.
SS, BW, and SL defined the research goals and designed the study. SS performed the Antarctic-ice-shelf-wide scale FDM-SMRT simulations, developed the optimization scheme, designed the visualizations used in the manuscript, and analysed the results. SV provided all IMAU-FDM profiles and data products and helped in analysing the results. SdRH helped in accessing the Antarctic-ice-shelf-wide scale ASCAT data for the period 2007–2021. WL helped in analysing the results and providing input to the optimization algorithm. All authors contributed to discussions on the paper.
The contact author has declared that none of the authors has any competing interests.
Publisher's note: Copernicus Publications remains neutral with regard to jurisdictional claims made in the text, published maps, institutional affiliations, or any other geographical representation in this paper. The authors bear the ultimate responsibility for providing appropriate place names. Views expressed in the text are those of the authors and do not necessarily reflect the views of the publisher.
The authors acknowledge the use of computational resources of the DelftBlue supercomputer, provided by Delft High Performance Computing Centre (https://www.tudelft.nl/dhpc, last access: 28 July 2026). We also want to thank Dr. Harish Baki for his support in DelftBlue supercomputer processing. During the preparation of this work, the authors used ChatGPT in order to enhance the readability of specific sections. After using this tool, the authors reviewed and edited the content as needed and take full responsibility for the content of the publication.
The work of Shashwat Shukla, Sophie de Roda Husman, and Sanne Veldhuijsen was supported by Nederlandse Organisatie voor Wetenschappelijk Onderzoek (NWO) under grant no. OCENW.GROOT.2019.091. The work of Weiran Li was supported by the NWO through the ENW.GO.001.040 project.
This paper was edited by Lars Kaleschke and reviewed by Shashi Kumar and one anonymous referee.
Alley, K., Scambos, T., Miller, J., Long, D., and MacFerrin, M.: Quantifying vulnerability of Antarctic ice shelves to hydrofracture using microwave scattering properties, Remote Sens. Environ., 210, 297–306, https://doi.org/10.1016/j.rse.2018.03.025, 2018. a, b, c, d, e, f, g, h, i, j
Amory, C., Buizert, C., Buzzard, S., Case, E., Clerx, N., Culberg, R., Datta, R. T., Dey, R., Drews, R., Dunmire, D., Eayrs, C., Hansen, N., Humbert, A., Kaitheri, A., Keegan, K., Kuipers Munneke, P., Lenaerts, J. T. M., Lhermitte, S., Mair, D., McDowell, I., Mejia, J., Meyer, C. R., Morris, E., Moser, D., Oraschewski, F. M., Pearce, E., de Roda Husman, S., Schlegel, N.-J., Schultz, T., Simonsen, S. B., Stevens, C. M., Thomas, E. R., Thompson-Munson, M., Wever, N., Wouters, B., and team, T. F. S.: Firn on ice sheets, Nat. Rev. Earth Environ., 5, 79–99, https://doi.org/10.1038/s43017-023-00507-9, 2024. a, b, c
Arioli, S., Picard, G., Arnaud, L., and Favier, V.: Dynamics of the snow grain size in a windy coastal area of Antarctica from continuous in situ spectral-albedo measurements, The Cryosphere, 17, 2323–2342, https://doi.org/10.5194/tc-17-2323-2023, 2023. a, b
Brucker, L., Picard, G., and Fily, M.: Snow grain-size profiles deduced from microwave snow emissivities in Antarctica, J. Glaciol., 56, 514–526, https://doi.org/10.3189/002214310792447806, 2010. a, b, c
Cartwright, J., Fraser, A. D., and Porter-Smith, R.: Polar maps of C-band backscatter parameters from the Advanced Scatterometer, Earth Syst. Sci. Data, 14, 479–490, https://doi.org/10.5194/essd-14-479-2022, 2022. a
Charrois, L., Cosme, E., Dumont, M., Lafaysse, M., Morin, S., Libois, Q., and Picard, G.: On the assimilation of optical reflectances and snow depth observations into a detailed snowpack model, The Cryosphere, 10, 1021–1038, https://doi.org/10.5194/tc-10-1021-2016, 2016. a
Clerx, N., Machguth, H., Tedstone, A., Jullien, N., Wever, N., Weingartner, R., and Roessler, O.: In situ measurements of meltwater flow through snow and firn in the accumulation zone of the SW Greenland Ice Sheet, The Cryosphere, 16, 4379–4401, https://doi.org/10.5194/tc-16-4379-2022, 2022. a, b
Cluzet, B., Revuelto, J., Lafaysse, M., Tuzet, F., Cosme, E., Picard, G., Arnaud, L., and Dumont, M.: Towards the assimilation of satellite reflectance into semi-distributed ensemble snowpack simulations, Cold Reg. Sci. Technol., 170, 102918, https://doi.org/10.1016/j.coldregions.2019.102918, 2020. a
Dattler, M. E., Medley, B., and Stevens, C. M.: A physics-based Antarctic melt detection technique: combining Advanced Microwave Scanning Radiometer 2, radiative-transfer modeling, and firn modeling, The Cryosphere, 18, 3613–3631, https://doi.org/10.5194/tc-18-3613-2024, 2024. a, b, c, d
Delft High Performance Computing Centre (DHPC): DelftBlue Supercomputer (Phase 2), https://www.tudelft.nl/dhpc/ark:/44463/DelftBluePhase2 (last access: 28 July 2026), 2024. a
de Roda Husman, S., Lhermitte, S., Bolibar, J., Izeboud, M., Hu, Z., Shukla, S., van der Meer, M., Long, D., and Wouters, B.: A high-resolution record of surface melt on Antarctic ice shelves using multi-source remote sensing data and deep learning, Remote Sens. Environ., 301, 113950, https://doi.org/10.1016/j.rse.2023.113950, 2024. a
Fraser, A. D., Nigro, M. A., Ligtenberg, S. R. M., Legresy, B., Inoue, M., Cassano, J. J., Kuipers-Munneke, P., Lenaerts, J. T. M., Young, N. W., Treverrow, A., van den Broeke, M., and Enomoto, H.: Drivers of ASCAT C band backscatter variability in the dry snow zone of Antarctica, J. Glaciol., 62, 170–184, https://doi.org/10.1017/jog.2016.29, 2016. a, b, c, d
Gelman, A.: Analysis of variance – why it is more important than ever, Ann. Stat., 33, 1–53, 2005. a
Greene, C. A., Gardner, A. S., Schlegel, N.-J., and Fraser, A. D.: Antarctic calving loss rivals ice-shelf thinning, Nature, 609, 948–953, https://doi.org/10.1038/s41586-022-05037-w, 2022. a, b
Kuipers Munneke, P., Ligtenberg, S. R., Van Den Broeke, M. R., and Vaughan, D. G.: Firn air depletion as a precursor of Antarctic ice-shelf collapse, J. Glaciol., 60, 205–214, https://doi.org/10.3189/2014JoG13J183, 2014. a, b, c, d
Leinss, S., Löwe, H., Proksch, M., Lemmetyinen, J., Wiesmann, A., and Hajnsek, I.: Anisotropy of seasonal snow measured by polarimetric phase differences in radar time series, The Cryosphere, 10, 1771–1797, https://doi.org/10.5194/tc-10-1771-2016, 2016. a
Ligtenberg, S. R. M., Kuipers Munneke, P., and van den Broeke, M. R.: Present and future variations in Antarctic firn air content, The Cryosphere, 8, 1711–1723, https://doi.org/10.5194/tc-8-1711-2014, 2014. a
Long, D., Hardin, P., and Whiting, P.: Resolution enhancement of spaceborne scatterometer data, IEEE T. Geosci. Remote, 31, 700–715, https://doi.org/10.1109/36.225536, 1993. a, b, c
Mätzler, C.: Relation between grain-size and correlation length of snow, J. Glaciol., 48, 461–466, https://doi.org/10.3189/172756502781831287, 2002. a, b
Medley, B., Neumann, T. A., Zwally, H. J., Smith, B. E., and Stevens, C. M.: Simulations of firn processes over the Greenland and Antarctic ice sheets: 1980–2021, The Cryosphere, 16, 3971–4011, https://doi.org/10.5194/tc-16-3971-2022, 2022. a, b
Moussavi, M., Pope, A., Halberstadt, A. R. W., Trusel, L. D., Cioffi, L., and Abdalati, W.: Antarctic Supraglacial Lake Detection Using Landsat 8 and Sentinel-2 Imagery: Towards Continental Generation of Lake Volumes, Remote Sens., 12, https://doi.org/10.3390/rs12010134, 2020. a
Noël, B., van Wessem, J. M., Wouters, B., Trusel, L., Lhermitte, S., and van den Broeke, M. R.: Higher Antarctic ice sheet accumulation and surface melt rates revealed at 2 km resolution, Nat. Commun., 14, 7949, https://doi.org/10.1038/s41467-023-43584-6, 2023. a
Ochwat, N. E., Scambos, T. A., Banwell, A. F., Anderson, R. S., Maclennan, M. L., Picard, G., Shates, J. A., Marinsek, S., Margonari, L., Truffer, M., and Pettit, E. C.: Triggers of the 2022 Larsen B multi-year landfast sea ice breakout and initial glacier response, The Cryosphere, 18, 1709–1731, https://doi.org/10.5194/tc-18-1709-2024, 2024. a
Pan, J., Durand, M. T., Vander Jagt, B. J., and Liu, D.: Application of a Markov Chain Monte Carlo algorithm for snow water equivalent retrieval from passive microwave measurements, Remote Sens. Environ., 192, 150–165, https://doi.org/10.1016/j.rse.2017.02.006, 2017. a
Pfeffer, W. T., Meier, M. F., and Illangasekare, T. H.: Retention of Greenland runoff by refreezing: Implications for projected future sea level change, J. Geophys. Res.-Oceans, 96, 22117–22124, https://doi.org/10.1029/91JC02502, 1991. a
Picard, G., Sandells, M., and Löwe, H.: SMRT: an active–passive microwave radiative transfer model for snow with multiple microstructure and scattering formulations (v1.0), Geosci. Model Dev., 11, 2763–2788, https://doi.org/10.5194/gmd-11-2763-2018, 2018. a, b, c, d, e, f, g, h
Picard, G., Löwe, H., and Mätzler, C.: Brief communication: A continuous formulation of microwave scattering from fresh snow to bubbly ice from first principles, The Cryosphere, 16, 3861–3866, https://doi.org/10.5194/tc-16-3861-2022, 2022a. a, b, c, d
Picard, G., Löwe, H., Domine, F., Arnaud, L., Larue, F., Favier, V., Le Meur, E., Lefebvre, E., Savarino, J., and Royer, A.: The Microwave Snow Grain Size: A New Concept to Predict Satellite Observations Over Snow-Covered Regions, AGU Advances, 3, e2021AV000630, https://doi.org/10.1029/2021AV000630, 2022b. a, b, c, d, e, f, g, h
Poizat, M., Picard, G., Arnaud, L., Narteau, C., Amory, C., and Brun, F.: Widespread longitudinal snow dunes in Antarctica shaped by sintering, Nat. Geosci., 17, 889–895, https://doi.org/10.1038/s41561-024-01506-1, 2024. a, b
Scambos, T., Hulbe, C., and Fahnestock, M.: Climate-Induced Ice Shelf Disintegration in the Antarctic Peninsula, American Geophysical Union (AGU), 79–92, ISBN 9781118668450, https://doi.org/10.1029/AR079p0079, 2003. a
Scambos, T. A., Hulbe, C., Fahnestock, M., and Bohlander, J.: The link between climate warming and break-up of ice shelves in the Antarctic Peninsula, J. Glaciol., 46, 516–530, https://doi.org/10.3189/172756500781833043, 2000. a
Shukla, S., Wouters, B., Picard, G., Wever, N., Izeboud, M., Husman, S. d. R., Kausch, T., Veldhuijsen, S., Mätzler, C., and Lhermitte, S.: Large Variability in Dominant Scattering From Sentinel-1 SAR in East Antarctica: Challenges and Opportunities, IEEE J. Sel. Top. Appl., 17, 14380–14393, https://doi.org/10.1109/JSTARS.2024.3438233, 2024. a, b, c
Shukla, S., Wouters, B., Veldhuijsen, S., de Roda Husman, S., Li, W., and Lhermitte, S.: Code and data for “Inferring Effective Firn Grain Size across Antarctic Ice Shelves from ASCAT Observations” (Version 1.0), Zenodo [data set], https://doi.org/10.5281/zenodo.21499624, 2026. a
Tedesco, M. and Kim, E.: Retrieval of dry-snow parameters from microwave radiometric data using a dense-medium model and genetic algorithms, IEEE T. Geosci. Remote, 44, 2143–2151, https://doi.org/10.1109/TGRS.2006.872087, 2006. a
Tsang, L., Durand, M., Derksen, C., Barros, A. P., Kang, D.-H., Lievens, H., Marshall, H.-P., Zhu, J., Johnson, J., King, J., Lemmetyinen, J., Sandells, M., Rutter, N., Siqueira, P., Nolin, A., Osmanoglu, B., Vuyovich, C., Kim, E., Taylor, D., Merkouriadi, I., Brucker, L., Navari, M., Dumont, M., Kelly, R., Kim, R. S., Liao, T.-H., Borah, F., and Xu, X.: Review article: Global monitoring of snow water equivalent using high-frequency radar remote sensing, The Cryosphere, 16, 3531–3573, https://doi.org/10.5194/tc-16-3531-2022, 2022. a
van Dalum, C. T., van de Berg, W. J., and van den Broeke, M. R.: Sensitivity of Antarctic surface climate to a new spectral snow albedo and radiative transfer scheme in RACMO2.3p3, The Cryosphere, 16, 1071–1089, https://doi.org/10.5194/tc-16-1071-2022, 2022. a
van Wessem, J., van den Broeke, M. R., Lhermitte, S., and Wouters, B.: Data set: Yearly RACMO2.3p2 variables, threshold temperature and Sentinel-2 melt pond volume, Zenodo [data set], https://doi.org/10.5281/zenodo.7334047, 2022. a
van Wessem, J. M., van de Berg, W. J., Noël, B. P. Y., van Meijgaard, E., Amory, C., Birnbaum, G., Jakobs, C. L., Krüger, K., Lenaerts, J. T. M., Lhermitte, S., Ligtenberg, S. R. M., Medley, B., Reijmer, C. H., van Tricht, K., Trusel, L. D., van Ulft, L. H., Wouters, B., Wuite, J., and van den Broeke, M. R.: Modelling the climate and surface mass balance of polar ice sheets using RACMO2 – Part 2: Antarctica (1979–2016), The Cryosphere, 12, 1479–1498, https://doi.org/10.5194/tc-12-1479-2018, 2018. a, b
van Wessem, J. M., van den Broeke, M. R., Wouters, B., and Lhermitte, S.: Variable temperature thresholds of melt pond formation on Antarctic ice shelves, Nat. Clim. Change, 13, 161–166, https://doi.org/10.1038/s41558-022-01577-1, 2023. a, b, c, d, e, f, g
Veldhuijsen, S.: IMAU-FDM v12AD TC release, Zenodo [code], https://doi.org/10.5281/zenodo.10723570, 2024. a
Veldhuijsen, S. B. M., van de Berg, W. J., Brils, M., Kuipers Munneke, P., and van den Broeke, M. R.: Characteristics of the 1979–2020 Antarctic firn layer simulated with IMAU-FDM v1.2A, The Cryosphere, 17, 1675–1696, https://doi.org/10.5194/tc-17-1675-2023, 2023. a, b, c
Veldhuijsen, S. B. M., van de Berg, W. J., Kuipers Munneke, P., and van den Broeke, M. R.: Firn air content changes on Antarctic ice shelves under three future warming scenarios, The Cryosphere, 18, 1983–1999, https://doi.org/10.5194/tc-18-1983-2024, 2024. a, b, c, d, e, f, g, h, i, j, k, l, m, n, o, p, q, r, s, t, u, v, w, x, y, z
Virtanen, P., Gommers, R., Oliphant, T. E., Haberland, M., Reddy, T., Cournapeau, D., Burovski, E., Peterson, P., Weckesser, W., Bright, J., van der Walt, S. J., Brett, M., Wilson, J., Millman, K. J., Mayorov, N., Nelson, A. R. J., Jones, E., Kern, R., Larson, E., Carey, C. J., Polat, İ., Feng, Y., Moore, E. W., VanderPlas, J., Laxalde, D., Perktold, J., Cimrman, R., Henriksen, I., Quintero, E. A., Harris, C. R., Archibald, A. M., Ribeiro, A. H., Pedregosa, F., van Mulbregt, P., Vijaykumar, A., Bardelli, A. P., Rothberg, A., Hilboll, A., Kloeckner, A., Scopatz, A., Lee, A., Rokem, A., Woods, C. N., Fulton, C., Masson, C., Häggström, C., Fitzgerald, C., Nicholson, D. A., Hagen, D. R., Pasechnik, D. V., Olivetti, E., Martin, E., Wieser, E., Silva, F., Lenders, F., Wilhelm, F., Young, G., Price, G. A., Ingold, G.-L., Allen, G. E., Lee, G. R., Audren, H., Probst, I., Dietrich, J. P., Silterra, J., Webber, J. T., Slavič, J., Nothman, J., Buchner, J., Kulick, J., Schönberger, J. L., de Miranda Cardoso, J. V., Reimer, J., Harrington, J., Rodríguez, J. L. C., Nunez-Iglesias, J., Kuczynski, J., Tritz, K., Thoma, M., Newville, M., Kümmerer, M., Bolingbroke, M., Tartre, M., Pak, M., Smith, N. J., Nowaczyk, N., Shebanov, N., Pavlyk, O., Brodtkorb, P. A., Lee, P., McGibbon, R. T., Feldbauer, R., Lewis, S., Tygier, S., Sievert, S., Vigna, S., Peterson, S., More, S., Pudlik, T., Oshima, T., Pingel, T. J., Robitaille, T. P., Spura, T., Jones, T. R., Cera, T., Leslie, T., Zito, T., Krauss, T., Upadhyay, U., Halchenko, Y. O., Vázquez-Baeza, Y., and 1.0 Contributors, S.: SciPy 1.0: fundamental algorithms for scientific computing in Python, Nat. Methods, 17, 261–272, https://doi.org/10.1038/s41592-019-0686-2, 2020. a
Xu, H., Medley, B., Tsang, L., Johnson, J. T., Jezek, K. C., Brogioni, M., and Kaleschke, L.: Polar firn properties in Greenland and Antarctica and related effects on microwave brightness temperatures, The Cryosphere, 17, 2793–2809, https://doi.org/10.5194/tc-17-2793-2023, 2023. a
- Abstract
- Introduction
- Data
- Methods
- Results
- Discussion
- Conclusions
- Appendix A: FDM-SMRT Coupled Simulation vs ASCAT Observation
- Appendix B: ANOVA Spatial Maps: IMAU-FDM Grain Size vs Optimized Grain Size
- Appendix C: Detailed results of the perturbation analysis
- Appendix D: Relationship between FAC and Grain Size
- Code and data availability
- Author contributions
- Competing interests
- Disclaimer
- Acknowledgements
- Financial support
- Review statement
- References
- Abstract
- Introduction
- Data
- Methods
- Results
- Discussion
- Conclusions
- Appendix A: FDM-SMRT Coupled Simulation vs ASCAT Observation
- Appendix B: ANOVA Spatial Maps: IMAU-FDM Grain Size vs Optimized Grain Size
- Appendix C: Detailed results of the perturbation analysis
- Appendix D: Relationship between FAC and Grain Size
- Code and data availability
- Author contributions
- Competing interests
- Disclaimer
- Acknowledgements
- Financial support
- Review statement
- References